
원문 보기
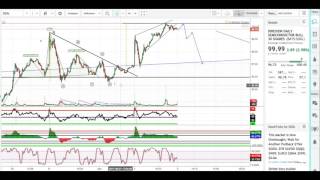
anyways that is my short-term thesis on GTX would be interesting to see how it plays out for the rest of the week so moving on to fess Oh Excel semiconductors a lot has been going on in semiconductors recently as far as a technical analysis perspective ghost sacks well I've been holding onto it for several months it's been an absolute darling of the stock I I love it and I recently sold out of it yesterday and you know it stocks like these that really make you question whether you should be a long-term holder or not we can see how much it's ran in the last year however from the technical perspective you know sometimes it's best just to take profits and wait for a pullback for a reentry and that's what I think I'm doing right now why am I doing this as a medium term short term and long term thinker all timeframes are bearish two slightly bearish forming at the moment as far as like I said a technical perspective goes for the long-term perspective we're nearing the end of our fifth wave super cycle so going back over here we can see that we had this consolidation zone this accumulation zone we broke out a new trend we have a one two three four and I have the fifth marked up here you can't really see it however we can identify that this channel right here is acted as pretty solid support and resistance for over the last year which usually a channel doesn't last that long so it is a significant Channel but recently I know it's a little bit foggy right here but we can see that we broke out of this channel we are above this channel now and therefore we are in a unsustainable new uptrend that has started its overbought on the daily timescale we can see that we are at a 70% 70 RSI today for our volume indicators our CCI we are at 250 which is extremely overbought at this point you can see that we've only been at this 250 level on the daily timeframe for the CCI once right here twice right here and this is the third time right now it also kind of goes hand in hand with the Elliot wave theory if you're not a big fan they're basically three waves there's a one wave the three ways and a fifth wave so that's kind of a little bit more support for the reason and rationale for my Elliot wave right here so we do have a 1 2 3 4 5 grand cycle that is coming to the end of its fifth wave in the medium timeframe I have a shorter timeframe five five wave Elliot wave that came in again the CCI indicator is a good indication of momentum and strength of a trend but I've also found that it's kind of you know good for using in Elliot wave theory kind of like I showed them a longer term time frame but we have our first wave here our second wave right here in our third wave right here and so I marked Elliot with 1 2 3 4 5 and so this is on a medium timeframe getting to the end of our fifth Elliot wave as far as RSI divergence goes I do see one I see that we have a very overbought range here on the RSI we have a higher high or lower high and here on the price action we have a high and then a higher high this is a divergence as price goes up but RSI goes down this is typically not the best case scenario we are at the 222 % fib level I guess I can see us running all the way up to the two sixty one point eight however we did already kind of get rejected off that I think our high here was 99 point sixty about and this is it looks like 120 so call it close enough as for do you shorter term timeframes look at the 15-minute then I drew a short term Elliott way that I saw so I see us having a 1 2 3 4 5 5 coming here at the peak and also tagging the top of our channel that's another thing to keep in mind is that the new channel that we draw that we drew it's at the very top of this new channel it's broken out at the highs of our longer-term Channel and it's at the highs of our new even more elevated channel and last but not least the dagger that I'm seeing right here for semiconductors and ultimate reason I sold out was this head and shoulders top that I see going on here and you can say that it broke out over here but then I would counter you with saying that it had this rise right here as well so perhaps a further existent zone might be this complex top that we have here a talked about complex tops is in xiv volatility which has been another darling this year you know I could even see the case being made for this to be a diamond top and this is very rare I've only seen you know two or three of them have never taken trade in them but you know this could be essentially a diamond top forming right here so that'd be interesting to watch play out you can see that we were you know not even we were basically flat for the day and I guess I'm happy that I took my profits so high but I would recommend that if you are holding those semiconductor stocks those in Nvidia those mu those AMD we can already see weakness in AMD I don't know it's just the case for the three times bull ETF semiconductor is not all that bullish at the point there's far more room to go down than there is for us to go up all right so that's my analysis for s o XL let's go on to crude oil you WT we



Comments 0