
저자: RyanHannifan · 외국인
요약 보기
결론: 반도체 3배 레버리지 ETF SOXL에 대해 단기·중기 약세 기술적 판단을 제시하나 장기적으로는 반도체 강세를 전망함. [기술적 분석 개요] 일봉에서 SOXL이 상승 채널을 상방 이탈한 뒤 과열 신호(RSI 다이버전스, 채널 상단, 헤드앤숄더 형성)가 나타났다고 봄. [엘리엇 파동 관점] 중기적으로 5파 종료 구간으로 판단했고, 이 구간에서 주당 약 27.2달러 부근에서 매도했다고 언급. [과거 예측 복기] 예측이 틀려 약 16달러 가량 추가 상승을 놓쳤다고 인정함. 이후 6월 5일, 6월 11일 예측은 맞았다고 주장. [단기 엘리엇 파동] 30분봉에서 9파 구조 가능성을 제기하고 약 5달러 부근 단기 5파 종료로 봤으나 결과적으로 9파 패턴이었다고 정정. [단기 하락 시나리오] 페넌트 측정 목표 및 하락 쐐기 패턴 기준으로 1차 목표 약 38.2 부근, 2차 목표 약 23.6 부근 제시. [헤드앤숄더 패턴] 좌·우 어깨와 넥라인 붕괴를 근거로 측정 목표가 약 66~67달러 라인이라고 제시. 우측 거래량이 더 높아야 한다는 조건을 언급하며 거래량 확인이 되었다고 주장. [지지 구간 및 시나리오] 23.6 지지 확인 후 이전 지지가 저항으로 바뀌는 반등 시나리오와 베어 플래그 가능성 언급. 80달러대 조정 시 추가 매수 의사 표명. [중립·장기 전망] 다음 주 단기 하락 가능성을 언급하나 '조심스러운' 입장이며 중기 바닥 가능성을 봄. [리스크] 자신의 예측이 틀릴 수 있음을 강조하고 여러 시나리오를 준비하라고 함. [출연자 전망] 단기 약세 가능성, 중기 바닥 형성 가능성, 장기적으로는 반도체 기술 혁명 수혜로 강세 전망. 80달러 부근 매수 기회 언급.
다듬은 글
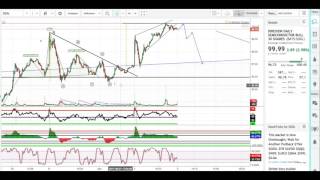
guys what's going on my name is Ryan I trade ETF and I like to make videos on the technical analysis that I'm seeing in the charts each week so today we're going to looking at SOE Excel which is the direction daily and semiconductor both three times ETF since it is a three times is a little bit distorted however I find that it tracks the one times ETF very well and we see the exact same pattern and therefore since I have the majority of my technicals on Fraxel and I trade stock so I'm just going to do my video on Sackville so let's go back to Soh cell and I've got this big blue box here and the reason for it quickly is I got a comment from somebody and I got a message they said shouldn't mean your version be kicking in here soon and I replied back with mean reversion did not kick in over the course of the last 16 months in 706 % bull run that we saw so I think that mean reversion in that argument is a fairly weak argument to make in regards to you know some price action that the majority or the herd is expecting I've been saying it for about three weeks now I have a bearish sentiment towards it I had a bearish case here for the longest time it said long term end of the Elliot wave medium term end of the fifth Elliot wave and short term and the fifth Elliot wave we far surpassed my to twenty seven point two fifths which is where I sold out of and is a noose unsustainable uptrend there's an RSI divergence we were at the top of our channel here and there's a head and shoulders so we're going to get into all of that I just wanted to dismiss kind of mean reversion argument I can very easily I don't want to say that I would necessarily trade against semiconductors I'm just saying that overall it's fairly weak right now and I would not be overly bullish necessarily as far as a medium term to long term prediction goes short-term yes I can definitely see it bouncing up but I just don't like the Amin reversion argument anyways let's dismiss that and get into the trading so right here we have our breakout into this beautiful long term up channel and as far as Elliott Wave goes we have a one two three four in fifth wave right here when we came into the fifth wave I saw a upwards channel breakout and this represented to me an unsustainable uptrend because for the longest time we had this really nice strong bullish run upwards in this channel and since it once weighed five I was kind of expecting some type of topping pattern and we definitely got that a lot of strong up trends are marked by some irrational exuberance and we broke out above this already very strong uptrend here and we went even more parabolic at one point getting to 113 I believe we were sitting down here at about eighty one point five dollars for socks also that represents a drop of about thirty about thirty three thirty-five dollars which is very significant had a huge pullback in the last two weeks and I'm very happy with my trades on SO excelled thus far so moving from the daily to the two hour chart first thing I wanted to establish was that we have these time clones these indicate you know points in time and I draw this low here to the next low it comes back and spits out basically where the next low is we have an intermediate move we have a you know right before the break out in our next one falls right around here so we're a little bit we're kind of in the middle of this channel right here in between these two time signatures however I do like to use these just kind of as a guide as to kind of expect some interesting moves to occur sometimes like right here nothing occurs but other times you know this time signature right here if you were to you know get weary of this right here you might have considered selling out or paying more close attention setting stop-loss and going to save yourself from this big downtrend here so I do still see them as being relatively significant this one marked a breakout before we had you know a $35 move upward and so sometimes it's hit or miss but uh I just like to point out what it is in the chart so there's been a little bit this was our new unsustainable uptrend I saw a wedge pattern going on here at divergence and an overthrow pattern which was very nice so what's an overthrow pattern well an overthrow pattern in a wedge is where it breaks out of these trend lines and so we come up we have our one two three four and then this would break out of this range before going back into it and falling all the way to the other side and I saw that definitely here in our chart we have our one two three four in five overthrow and then we break down we break down below it so as our divergence went I saw two of them our RSI right here was about 82 83 84 and this one over here was slightly lower but lower nonetheless at 80 therefore I was looking for other divergences and I saw it right here as far as the volume the bullish sentiment going into it it was in a Down and it never came back up to test these high levels up here while Christ continued to set higher highs here this is a regular divergence here in the price action divergences can take place over you know a month a week a day but I do find them significant and ultimately they come into play so that was the rationale behind my bearish sentiment I was definitely losing a lot I wasn't losing a lot I wasn't in a position but I was bearish and wrong for a long time I like to admit when I'm wrong because I do provide predictions as to where price goes and if I only show the predictions that are correct then you know how legitimate am I I like to show predictions where I'm wrong as well and so right here I sold out of my shares we were at the 227 sideline and I was holding to axle for a very long time and ended up to take a nice profit here at this levels however I should recognize that this was kind of a flag pattern and we ended up doubling that move and running up about a you know sixteen dollars higher than where I sold out us so it's kind of salty about that and for about a week week and a half I had to admit that I was wrong however it did come to play out fairly nicely as to what our predictions was now I haven't changed up this ABC or these lines you can go back to my other videos and take a look at that but this downwards prediction is fairly nice for me and and just to prove that here is on June 5th my record for so I sell this is just what I was seeing as far as Elliot waves and a little bit of description as to why I thought that and we ended up breaking down stuff my June 5th one why haven't even nicer one for the record which is here so this was June 11th I said that we were going to come down to a we probably bounce back up to this previous area of consolidation right here the 61 point 8 will act as resistance and we'll come back down here to see which is the original beginning of the wedge down here let's see is how I did so you know I did pretty well the next day we came down and basically touch this 38.2 range which is where my arrow is pointing I don't know if you can see this wick right here bounced off we hung around that'd be the sixty one point eight but then we finally were coming down to see right now so I'm pretty happy with on my analysis axis so far but what's going to happen in the future we're going to discuss that very shortly so in the beginning I said I had a medium term end of Elliot wave so I had a one two three four five sold out when we started to make this v wave I'd F and let's go to the short term Elliot wave that I saw on a thirty minute on the thirty minute I had a hunch that this was a nine wave pattern which is the topping pattern after a long bullish run certainly had that it's actually a nine wave Elliot wave pattern it's kind of complicated and I had a hunch here but I sold at the short-term end of the fifth Elliot wave here at about five however it was actually a nine wave pattern so we had a one two three four five six seven eight and nine nine marks the end of the Elliot wave and it's kind of rare to see these and so I was interesting to see a play out anyways we came back down we set in what I thought was this pennant formation and came down set our first area of support came up set our first area of resistance this is a B C D and E and after I played out you can see that we broke down all the way and technically speaking I had a measured moon for the pennant which is from the low all the way up to the high first resistance in the first sport zones and you take that and you drag it down to the point of breakdown which would be right here in this case and technically speaking this would be the point which would be my target to my first target was over here in this range and my second target was down here at the 23.6 beginning of the consolidation and the wedge and the measured move from the pennant I am seeing some interesting patterns may be something to watch out for in the coming days and weeks and we'll get to that here on the 15 minute chart so there's a couple price predictions that I have here I guess you can see my target one right here was at the thirty eight point two two not your support if you were to ignore all of these patterns right here in fact let's go ahead and do that so I went ahead and delete all those and I think it makes the picture a little bit clearer here but I see a bit of a head and shoulders going on here and that is a quite a scary picture to be seeing here on one of the strongest sectors in the market so what I see here is we come up we set our left shoulder come down get supported we come up set our head we come down then we set our right shoulder right here and then we break down from this neckline to take from the bottom support of the left shoulder and the next support level of the right shoulder you continue to drag it off we broke our neckline right here we came back up to retest it and then we broke down lower now to me it looks like we were being supported by the 23.6 as well as my original theory that this wedge will hold up the theory behind wedge is that you typically go and reverse all the way back down to the beginning of it but if this is a true Head & Shoulders which is giving some indications of it says that volume on the right side should be significantly higher than volume on the left side and that we see that in a volume as well as the price section so the measured move for your head and shoulders you take it from the head all the way down to the neckline and then you take that neckline or you take this I have it in this orange dotted line going down here you take this and you bring it to the point of breakdown so in my opinion the point breakdown would be right here would be at this point right here where we lost the neckline so clone this drag it over here and this would be our measured move which actually has us coming down all the way to this prior support zone right here and I think that this would be a hard support zone because we have a lot of sideways movement consolidations right here but I do want to note everything that I see on the chart my first target was this range right here and therefore I provided two price predictions here the goal is not to be correct all the time it's to be prepared I can easily see either of these cases happening so as far as this goes I do think we have further to fall we haven't touched the support yet but we were very close to it we broke down below this 38.2 which was our previous support zone for these two these three of these four and so our next sport zone is going to be done here at 23 this kind of looks like a bear flag to me here on the 15-minute chart I can see us coming down here touching this 23.6 hitting our actual bottom running up to our previous support zone support becomes resistance and then falling back down making a slightly higher low and then after this we'll have gained enough bullish momentum to come to test this neckline right here we'll flag out sideways and then move higher which will coincide with this time Fibonacci level is for the bearish case our technical target for the head and shoulders will be right down here at the 66-67 dollar line so it will be very interesting to see what semiconductors do next week go to s mhm you kind of see that same pattern here we go to s oxx delete this you see that same pattern playing out here so yeah I'd be a skeptical maybe not bearish on semiconductors simply because it's been such a strong sector so far in the year I'd be I wouldn't be necessarily bearish on it however price for the very short term is pointing lower as far as the medium term goes I think that will catch a pretty good bottom right here and let's go ahead and label that like I try and do each week we'll call this target 3 and as for the long term I do think that semiconductors will continue to play a major part in the technic technology revolution that the world is experiencing and I'm bullish on semiconductors in the long term we might look back at this in 3 4 or 5 months and say that this would've been a great buying opportunity and I think that that's that will be the case and that's why I added plenty of stock so when we dip down here to about the 80 dollar range so with this in mind hopefully that gives you something to expect for next week and I wish you the best of luck in your trading we just you got anything on this video like and subscribe it helps me out a ton I appreciate you guys for watching me and taking time out of your day and enjoy the long weekend happy 4th of July




Comments 0