
저자: RyanHannifan · 외국인
요약 보기
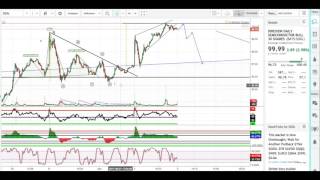
반도체 3배 레버리지 ETF SOXL에 대한 기술적 분석으로, 결론은 단기·중기·장기 모든 시간대에서 약세 전망이며 발언자는 이미 매도했다는 입장이다. 단기 관점: 15분봉에서 1-2-3-4-5 엘리엇 파동이 고점에서 완성되고 있으며, 채널 상단을 건드리는 중이라고 본다. 중기 관점: 일봉 기준 RSI 약 70, CCI 약 250으로 극단적 과매수 상태이며, CCI 250 수준은 과거 세 차례 밖에 나타나지 않았다고 설명한다. 중기 관점(파동·다이버전스): 가격은 고점을 높이는데 RSI는 낮아지는 하락 다이버전스가 나타나고 있다고 지적한다. 중기 관점(피보나치): 2.22 피보나치 레벨에 도달했고, 상방 목표로 2.618 레벨(약 260)을 거론하지만 이미 약 120 부근에서 저항을 받았다고 본다. 장기 관점: 5차 파동 슈퍼사이클의 종착점에 가까워졌다고 보며, 장기간 유지된 채널을 이탈해 과열된 신규 상승 추세에 들어섰다고 해석한다. 패턴 관점: 헤드앤숄더 고점 형성과 XIV(변동성 ETF) 차트의 복합 고점, 다이아몬드 탑 가능성을 언급한다. 매도 근거: 이 같은 고점 신호들 때문에 전일 SOXL을 매도해 이익을 실현했다고 밝혔다. 관련 종목 조언: 반도체 주식(엔비디아, 마이크론, AMD 등)을 보유 중이라면 주의가 필요하며, AMD에서 이미 약세가 나타나고 있다고 언급한다. 리스크·조건: 현재 가격 위치에서는 상승 여력보다 하락 여력이 훨씬 크다고 보며, 대기 후 조정(풀백) 시 재진입을 고려하겠다는 입장이다. 출연자 전망: 발언자 본인은 SOXL에 대해 단기·중기·장기 모두 약세(하락) 관점을 취한다. 다음 영상 예고: 원유(WTI 등) 분석으로 넘어간다.
다듬은 글
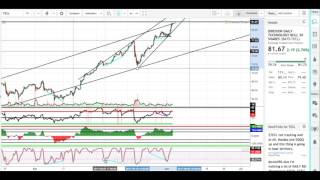
anyways that is my short-term thesis on GTX would be interesting to see how it plays out for the rest of the week so moving on to fess Oh Excel semiconductors a lot has been going on in semiconductors recently as far as a technical analysis perspective ghost sacks well I've been holding onto it for several months it's been an absolute darling of the stock I I love it and I recently sold out of it yesterday and you know it stocks like these that really make you question whether you should be a long-term holder or not we can see how much it's ran in the last year however from the technical perspective you know sometimes it's best just to take profits and wait for a pullback for a reentry and that's what I think I'm doing right now why am I doing this as a medium term short term and long term thinker all timeframes are bearish two slightly bearish forming at the moment as far as like I said a technical perspective goes for the long-term perspective we're nearing the end of our fifth wave super cycle so going back over here we can see that we had this consolidation zone this accumulation zone we broke out a new trend we have a one two three four and I have the fifth marked up here you can't really see it however we can identify that this channel right here is acted as pretty solid support and resistance for over the last year which usually a channel doesn't last that long so it is a significant Channel but recently I know it's a little bit foggy right here but we can see that we broke out of this channel we are above this channel now and therefore we are in a unsustainable new uptrend that has started its overbought on the daily timescale we can see that we are at a 70% 70 RSI today for our volume indicators our CCI we are at 250 which is extremely overbought at this point you can see that we've only been at this 250 level on the daily timeframe for the CCI once right here twice right here and this is the third time right now it also kind of goes hand in hand with the Elliot wave theory if you're not a big fan they're basically three waves there's a one wave the three ways and a fifth wave so that's kind of a little bit more support for the reason and rationale for my Elliot wave right here so we do have a 1 2 3 4 5 grand cycle that is coming to the end of its fifth wave in the medium timeframe I have a shorter timeframe five five wave Elliot wave that came in again the CCI indicator is a good indication of momentum and strength of a trend but I've also found that it's kind of you know good for using in Elliot wave theory kind of like I showed them a longer term time frame but we have our first wave here our second wave right here in our third wave right here and so I marked Elliot with 1 2 3 4 5 and so this is on a medium timeframe getting to the end of our fifth Elliot wave as far as RSI divergence goes I do see one I see that we have a very overbought range here on the RSI we have a higher high or lower high and here on the price action we have a high and then a higher high this is a divergence as price goes up but RSI goes down this is typically not the best case scenario we are at the 222 % fib level I guess I can see us running all the way up to the two sixty one point eight however we did already kind of get rejected off that I think our high here was 99 point sixty about and this is it looks like 120 so call it close enough as for do you shorter term timeframes look at the 15-minute then I drew a short term Elliott way that I saw so I see us having a 1 2 3 4 5 5 coming here at the peak and also tagging the top of our channel that's another thing to keep in mind is that the new channel that we draw that we drew it's at the very top of this new channel it's broken out at the highs of our longer-term Channel and it's at the highs of our new even more elevated channel and last but not least the dagger that I'm seeing right here for semiconductors and ultimate reason I sold out was this head and shoulders top that I see going on here and you can say that it broke out over here but then I would counter you with saying that it had this rise right here as well so perhaps a further existent zone might be this complex top that we have here a talked about complex tops is in xiv volatility which has been another darling this year you know I could even see the case being made for this to be a diamond top and this is very rare I've only seen you know two or three of them have never taken trade in them but you know this could be essentially a diamond top forming right here so that'd be interesting to watch play out you can see that we were you know not even we were basically flat for the day and I guess I'm happy that I took my profits so high but I would recommend that if you are holding those semiconductor stocks those in Nvidia those mu those AMD we can already see weakness in AMD I don't know it's just the case for the three times bull ETF semiconductor is not all that bullish at the point there's far more room to go down than there is for us to go up all right so that's my analysis for s o XL let's go on to crude oil you WT we



Comments 0