저자: RyanHannifan · 외국인
요약 보기
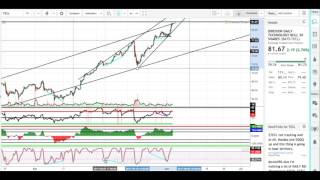
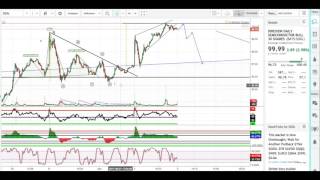
한 줄 결론: 기술주·반도체 레버리지 ETF(TECL 등)는 1년간 채널 상단에서 과열 상태이며 단기 조정 가능성이 있으나, 이 영상 자체는 매도보다 일부 차익실현과 조정 후 재진입을 제시한다. 전반적 시장 진단 기술주 전반이 과매수 구간에 있으며 주간 RSI가 2014년 중반 이후 최고 수준(약 82~83)에 근접했다고 설명. 상승 추세 자체는 강하다고 보며, 기술주가 곧 폭락할 가능성은 낮다고 판단. TECL 차트 분석 일봉에서 다이아몬드 지속형 패턴 확인, 최근 1년간 채널 내 상승(약 30달러대 → 81달러 부근). 2시간봉·1시간봉·30분봉에서 슬로우 스토캐스틱과 RSI에 히든 및 일반 약세 다이버전스가 여러 차례 나타남. 상승 쐐기(rising wedge)가 형성 중이며 하방 이탈 가능성 언급. 가격 목표 및 차익실현 구간 저항선 기준 약 82달러, 피보나치 161.8% 기준 약 83.5달러를 차익실현 후보로 제시. 채널 상단 도달 시 횡보하거나 빠르게 하락하는 경향이 있다고 설명. QQQ 분석 일봉 다이아몬드 패턴 이후 상방 돌파, 장기적으로 쐐기형 수렴 구간 접근. 주간 RSI가 역대 최고 수준(81)에 도달, 과매수 상태 강조. 추격 매수는 신중을 권고했으나 공매도 추천은 하지 않음. 개별 기술주 및 역사적 비교 마이크로소프트 1998년 고점~2009년 저점 상승폭과 최근 기술주 상승폭이 유사하다는 비교 제시. 리스크 및 조건 과열 구간에서 추격 매수 위험, 다이버전스 발생 시 조정 가능성. 반도체 레버리지·인버스 변동성 ETF 공매도는 여러 투자자가 고점에서 손실을 본 만큼 권하지 않음. 출연자 전망 단기 조정 가능성 인지, 과열 해소 전까지 신규 진입 신중, 일부 이익 확정 권고.
다듬은 글
guys what's going on my name is Ryan I do technical analysis on three-times ETF and like to make videos of it and share them with you sorry I didn't get a video out last Thursday I was busy redoing a bunch of my charts a few of my trades weren't going my way and I decided to take a deeper look into them and discovered a lot of cool stuff that I'm looking to share with you that being said this video might be a little bit longer and I'm going to try and briefly explain a couple patterns that are lesser-known that I had to look up and explore the different patterns in volume um indications behind them in order to kind of recognize the patterns in the charts I think that some of the reasons that most people that you know a lot of people are getting things wrong in this sideways market or whatnot is that they're looking at the typical patterns such as you know the descending triangle or the flag pattern and whatnot and not some of the lesser known patterns that being said let's get it going got more going on with the title shirt I guess so here we are at the daily you can see this nice diamond continuation pattern me out here I hadn't seen this before until you know I really spend a lot of time working on these charts and looking at all the patterns throughout the history and whatnot because I've found that a bunch of the patterns that I found today have repeated themselves in recent history but this diamond pattern is kind of cool to see I think it was the only one that I saw of the ETF's that I had reviewed so we're on the daily chart let's move in here real quick the Tekel chart looks a whole lot like the xiv volatility in s o XL semiconductors or ETFs honestly I don't have a ton to say about these stocks comparatively to you know your GD X which have more complicated patterns at the moment I mean basically to me this just looks like an extremely bullish run that we're having right now where we've been in the channel for the last year we've moved up what is it $30 - we're at 81 right now over the last year and it doesn't seem to be slowing down anytime soon I've identified some support and resistance lines and we'll zoom in close to the chart and then I want to take a look at the RSI just right off the bat let's go ahead and look at the weekly RSI because I think it's kind of the message I want to share about these stocks these technology stocks a semiconductor stocks AME volatility inverse stock is that the artists eye is at almost historical highs you can see that over here in it looks like mid 2014 we're at 83 and right now we're trading at 82 RSI which is extremely high I'll show you again what I mean on QQQ but let's just zoom in here real quick and check out some of the things I'm seeing here in cycled so let's go from the weekly to the two-hour so like I said you're just in a straight uptrend I can't really you know I could identify some Elliot wave patterns but you know a market will remain overbought for longer periods than you think for example I sold out of my shares I bought a bunch on this dip and I sold out at this double top here little did I know that it still had you know five bucks left to run and I just wanted to secure some profits nobody ever went broke taking profits like this so here in the to our chart let's just look at the time fibs we've got a low here high here high here breakout here and I'm not sure what this is going to be over here you know I think it has the potential to be a top you can see down here we hit a bottom we to the top we hit the bottom we missed we came up halfway we missed the top we missed the bottom and we came up here and we hit the top three times came back down hit the bottom we came up here and we didn't hit the top and we came back down and punch the bottom again and now we're hitting the top again so the reason I went through that is just to illustrate you know this this channel we're in right now is a very strong and tight channel whenever it hits the top it has a tendency to either a move sideways or be you know go down fairly quickly and I'm not the kind of trader who likes to you know sit on a stock that's moving sideways for several weeks that's just me this is not a long-term investment for me but these time fibs here kind of outline those price points and times so if you skip every other you've got a low a high halfway up and this might be a high again you know if you want to go with the pattern it might be a low again it might be down here but I think we have some pretty well defined support zones and I don't think that technology stocks are going to crash anytime soon I think that you know technology is the future and basically the market will go down the first indication that technology is going to go down and at the moment I don't think that you know Wall Street is going to let the market go down without you know forewarning for example I mean what I mean by forewarning is I can't identify any bearish sentiment right now in any of the technology stocks however as soon as we start hitting stuff like this and we continue moving on up and then we drop big like this we move sideways and we pop a little bit you know that's kind of a warning indicate that you know things are going in more sideways they're getting more choppy but the nice thing about these facts is they'll have these nice long beautiful runs up we'll just run up and up and up but as soon as you know I start seeing some of this stuff I'll be able to you know try and identify some of that right now we are just screaming higher and it's pretty crazy let's move into the one I wear real quick so just on the one hour I've identified in these light blues and you'll see that throughout all of these ETFs I talked about some divergence patterns and let's just talk about the device divergence patterns here real briefly so here is my slow stochastic it's really good at identifying divergences in price so we see down here we're basically at highs and we come in set lows in we pop up in price we come in and we set higher lows while price makes a lower low and we do it a third time which makes it significant especially since I'm the one hour chart and we make a higher low again and this makes a lower low from right here and right here so this is a bullish hidden divergence right now you actually know this isn't it this is a regular bullish divergence we got going on price right here and then I saw something right here doing my analysis we've got a actual hidden divergence where the slow stochastic comes way down sets this low price moves up even higher and then it dips down and our slow stochastics makes a lower low the price makes a higher high so that's what I mean when I'm talking about these divergences here in this chart um then you know we did end up having that huge reversal that sell-off and ran back up we're coming into the third divergence here where we run up in price our slow stochastic dips down a little bit then you come and run up to more in price and then the slow stochastic makes a lower low so we've got a higher high in price and a lower low in our slow stochastics this is another hidden divergence and it's got me a little bit nervous about what's going to happen this title and QQQ what I've got going on here is kind of a rising wedge that I'm seeing it was only created because of this massive sell-off and I don't know whether just to ignore it or not just try to put all the information out there so basically we've got this rising wedge going on I've got this kind of making I mean it's almost a parallel channel but it's not most have to do this just so you can see the charts it's risen so high but you can see a little bit clearer here this is a lower angle resistance line and this is a higher angled support line essentially these two are going to come to an apex and price has to be downwards all right so these divergences have been pretty good at predicting price we have a reversal here we have a reversal here and now I've got a bearish one right now like I said I'm not going to be the one to short any of these you know your semiconductors your technology your inverse volatility ETF's because I think that a lot of people have gotten burned on the top summers but let's move on to the 30-minute chart see if we have any from here I forgot to mention that this RSI is another indication this RSI has moved way down and this price has continued to rise that's a second it's a second divergence that we have here in the exact same timer and got a larger one here in stock and got a shorter one here in the RSI both are pretty significant if we look at our time fibs again we're coming up on this one right here I just give you a sense of you know time line if you do believe in this I think you know it's somewhat helpful to not be be all end all all right so let's move on to the 30 minutes so I've got a mini Elliot wave outlined here I think you know we came down we set our low and we popped back up and came with the steam pulse wave we had a one two wrong three consolidated for an hour and five along the way we came in with this descending triangle which is a bullish pattern because price rises into it we hit our top we set our resistance line and come down confirm our support line set our a b c d e and we break out with conviction so as far as resistance points go higher places to consider exiting if you are holding this etf would be this one forty one point four two praetorium exigence draw these out so you guys can see what I'm talking about here this is our 140 150 tradesmen right here next up is the 161 up here I've got a $82 sell target for the 141 I find the one sixty one point eight more significant sometimes and that's at about eighty three fifty just perhaps two potential places to take profit set and if you don't like the shorter timeline this is about a month long janaki level we can go all the way back here and go to this top right here this consolidation zone and we get the exact same thing this lines up with the one forty one point four so this is a double resistance zone and it is the one hundred and sixty one point eight percent Fibonacci and so yeah one more time about eighty 158 and the other one is 83 50 so you know nobody ever went broke taking profits um we never hit our top over here we came down plus their bottom we are currently sitting on top over here as well as the fist wave of the Elliott Wave coming in I just wouldn't be afraid to take them off the table waiting a week and maybe getting in at a similar or lower price let's go - keep your cue I have some notes for QQQ outlined that continuation diamond that we had right here in the middle and then we just bust out the upside here you do see a more well-defined sending wedge here going on then we head in tackle it is a longer term which means more significant you can see that you know this is a clear you know previous trend that we have yet to retouch and we see that this is the new trend going on here and we are coming to the apex point right here and I would be careful too long a position right now it seems like you would be chasing my honest opinion but then again I would never recommend shorting this it's just you know futures are basically another thing that kind of sets me off is we have these wider longer term grouping patterns and then they get skinnier as we go up here and that just means that price is kind of getting squeezed here and we finally it looks like it our top finally is the first time we get this top since well early 2015 so you can see how overbought we are it's a weekly I wanted to touch on qqq's weekly RSI level because we are actually hitting a new all you're at the previous all time I hear of 81 and this is the second time it looks like oh no looks like the third time ever that we've hit this RFI level which means it is overbought undeniable right now you can't say it's a long-term investment you know I guess you can you can say it's a long-term investment but my point stands is that we are overbought for example if you come down to the regular overbought zone which is 70 we've got one two three four five six seven eight nine ten times that we touch it it's you know a lot more reasonable to hold on to a position when it's at 70 our and still considered overbought as opposed to holding it onto a t1 or in worse you know entering a new position again just my two cents so I just wanted to share that about QQQ last but not least with technology I was I was looking at some comments and this one individual brought up the interesting thing about Microsoft and he attached this quote which I really loved which was by Mark Twain who said that history never repeats itself but it rhymes and this is shown very clearly here in the chart for Microsoft I think and I'm just going to draw it out for you so you guys can know what I mean so we've got our top over here and Microsoft clone it and back in 1998 so good while ago and bring it to the lows down here in 2009 and you can see that this clone from the low of Microsoft to tie it is about the exact same price that we are at right now from our low to our high you know 12 years later so that's the last comment I have on technology stocks is you know be careful maybe secure some profits maybe wait for a pullback or consolidation growing technology is you know the future and I'm not Irish on it at all I'm just saying that I'm not foolish because the following facts I stated all right so from technology let's move on to semiconductors which at that



Comments 0