저자: RyanHannifan · 외국인
요약 보기
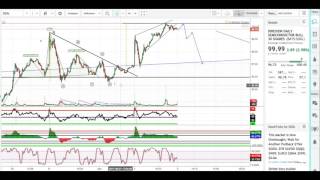
반도체(SOXL) 단기 기술적 분석 영상으로, 결론은 단기 약세 전망이다. 발표자는 93달러 근처 이중 천장에서 일부 매도했고, 이후 추가 상승분을 놓쳤지만 이익 실현은 문제없다고 설명했다. 장기 관점에서는 엘리엇 파동 상승 사이클이 진행 중이라고 보지만, 일봉·2시간·1시간봉에서 RSI·스토캐스틱 다이버전스가 나타나 과매수 경고가 있다고 짚었다. 1분봉에서는 하락 삼각형 및 쐐기형 패턴을 근거로 들었고, 거래량 감소 패턴과 측정 목표치(약 127달러)를 제시했다. 단기적으로는 한 번 더 상승(약 120달러 부근)해 이익 실현 후 되돌림이 나올 수 있으며, 되돌림이 쐐기 패턴의 돌파 지점인 약 97달러까지 이어질 수 있다고 전망했다. 발표자는 오늘 상승분을 반납할 가능성이 높다고 보며, 단기 변동성 확대를 경계했다. 리스크: 엘리엇 파동 9파 가설과 패턴 해석은 주관적이며, 상승 추세가 예상보다 길어질 수 있다. 이 영상은 단기 트레이딩 관점의 기술적 분석이며, 장기 투자자에게는 보유를 권하는 입장도 함께 언급했다.
다듬은 글
let's move on to semiconductors which has a similar story on the daily here let's let's just look at my bearishness I ended up selling out early again I sold out at the double top here at about 93 bucks I missed you know $7 run again nobody ever went broke you know taking profits even though I do wish that I had held on to it but I do have a beer casement just sell for any old reason so the bear case is that the long term and Elliott Wave we have a breakout here 1 2 3 4 5 this is the supercycle Elliott Wave medium-term and of Elliott Wave or medium-term is one two three four or five short-term and the fifth Elliott Wave and we'll touch on that in the lower timeframes we're at the two hundred and twenty seven point to fib resistance level we've set a new unsustainable uptrend you see that you know we rolled this uptrend for a very long time and we are just starting to set a new higher uptrend which you know it's kind of a warning sign that we are overbought there's far side divergences all over the place we are touching the top of the channel many times in a row and I saw a head and shoulders even though I'm not sure if that's still valid at this point so going from the daily let's go to the two-hour you can see that we are beginning to be overbought in the RSI level and we have much on the to our charts for the one-hour chart so the one-hour chart shows a better picture of the medium-term Elliott Wave I was talking about we've got a 1 2 3 4 5 up here target exit and then I found a third smaller Elliott Wave here when we had that big drop same thing we had a 1 2 3 4 5 that's at the same level as it was up here at the end of the fifth Elliott Wave and you can see how strong this resistance level is here just because of the wick on this candle that's profit taking comes back down the exact same thing happened over here at the 3rd waves the end of the third wave however what's interesting is the RSI divergence and that's tripped me up originally and reason I ended up selling out so we've got this extremely overbought RSI over here and I can just drag it down here and you see the RSI is the lower lower lower lower we have yet to come back to this high and meanwhile our price has made a higher high currently significantly higher high and this is an RSI divergence I think stochastic divergences are easier to find but RSI divergence is car smithing in their own right anyways here at the end of our 34 here we come down to our stochastic and we have a lower high where we have a higher low and then we have a lower lobe while price makes a low and then a higher look again this is just two different divergences and this for warns that potential you know pricing could be at risk I guess the best way to say it so from the hourly chart we'll see five anything in the 30 minute chart and the 15-minute chart I'm starting I think this might be a nine wave pattern which does happen at the end of the fifth wave often and so this could just this is a continuation of the Elliott Wave it's a nine wave pattern so however trading you doesn't have a 9y pattern so i just restarted the Elliott Wave trend but do one two three four five six seven eight nine and nine is our ending price I guess you would say well here's the second diamond that I found I guess so I thought this was a head and shoulders we come up left shoulder head right shoulder and I was afraid we're going to break down sold my shares turns out you know I think this might be more of a diamond to be honest with you you come up here and you know you see the shape I don't have to explain it but the main thing is that we go from high to low in 1:1 move basically so after taking a second look at this this diamond pattern here in the middle the trend signals a continuation pattern and that would fall in line with our prediction that we're doing a nine-minute pattern here on the I guess this would be five six on the seventh wave here I see an RSI divergence which means that you know I am highly convinced that price will fall in the near term future not going to fall a lot but isn't probably going to you know get back the games at head say we're at two hundred sixty one point eight now um we're above these highs we are above our channel which like I said before has acted as extremely firm resistance in the past and you want to talk about volume we can see a ton of buyers taking profit right here and a ton of short positions coming into the market with this volume right here is this bare red volume and what's next is we have an RSI divergence we have this high coming down coming down and we have yet to get above this you know descending light blue line while price makes this higher high here for semiconductors so do I have anything on the one-minute I don't think I do ooh I do so in one minute here here is my my thesis for selling out in the head and shoulders so just to you know this could have been a head and shoulders a diamond continuation pot pattern or a descending triangle and at the moment it looks like you know I'm convinced that we have a descending triangle going on here so we tell them touch spike out set our first resistance come down confirm our support and set our a b c d e again install up a little bit and then we break out and we really break out another thing that i you know while doing a little bit of studying this weekend um i look more at volume and during these dips for descending triangle it basically makes it descending triangle and the volume as well except for during breakout phase so volume is supposed to trend lower when it reaches the high it spikes back up lower spikes back up lower and then we are at our final E and it moves sideways and I have a few more examples of this in my videos and I'll show you it again if you're not convinced so and then another thing I studied up on is measured moods and for the descending triangle you're supposed to pull it from the high down to the low and we had you know an ultimate low down here about you know 20 cents lower but it was a wick and there's a double wick here and the double wick matched up with this over here so don't get mad at me for not pulling it all the way down so you're supposed to take this I quote into this these dots down here and you're supposed to pull it over to the breakout zone which was right here and this is your measured move and you're supposed to you know sell at this I guess this would be 127 or whatever and it worked out pretty well actually and I've been finding that works out fairly well last thing I guess on one-minute chart that has got me spooked and the reason why I think semiconductors are still going to fall you know just like technology and inverse wrong fix inverse volatility I am never going to recommend a short position you know if these are long term holds for you go ahead and hold it but I'm a shorter term trader so we have this new breakout here and we're definitely in a wedge pattern so we come up here this is our high this is our second high and a wet pattern is confirmed with five touches that's three on one side and two on the other so we have 2 here and 3 here and so this is basically the pattern I mean another thing about the descending triangle that it talks about is the retouch and I guess you know we break out here and you come back down if you want to count this as the retouch you can it says that the retesting of the previous resistance line usually comes at the apex which you know is pretty dang close to the apex right here so that's another thing I'm going to touch on it's why I just explained it anyways we come back up and make these smaller moves and we get compressed here and we actually fall lower at the same time you can see the RSI is turning down there's kind of a divergence going on here this is what I'm talking about when I say divergence higher RSI lower RSI high price higher price and another thing is our stochastic is moving down down down at a rapid rate while price is moving down at you know a pretty moderate rate so what I expect is like I said earlier about my descending triangle is this apex is very important for some reason and the fluctuations of price after a breakout so this is a breakdown but this wedge pattern hasn't hit its apex yet I predicted that's going to fit its apex right about here so I think that you're going to have one more leg up to 120 or whatever and you know maybe take some profits set of stop-loss or something like that and then I think that we're going to come back down test the support area over here this is moderate support we've got a low view high here and a high here so this is moderate support and I recognise that and so I think that we might bounce and offer a second chance to get out but with wedge patterns the pattern is supposed to go all the way back down to the breakout point which I'm saying is down here at about ninety seven dollars so I do think that we're going to give up today's gains and after that it's anybody's it's anybody's game it could move up higher we still have I think two waves less yeah so this is the top of our seventh wave now if we believe in our continuation nine a pattern so this would be again one two three four five six seven eight nine we're supposed to set a higher high yet not sure how much higher the price can build up anyways that's my analysis on semiconductors as of right now I'm very very short-term bearish on it it's going to volatility let's just get the big three out of the way


Comments 0