
원문 보기
How are you, traders? With you Tom and a new video. Today we will discuss market sentiment. Sentiment is something you need to understand when trading or investing in anything. Remember the famous quote from Warren Buffett: "Be fearful when others are greedy, and greedy when others are fearful." So, let's see how you can take advantage of this in the future.
Stay with us. Before we begin, I want to tell the viewers: no matter when you watch this video, these concepts remain relevant. And although we will give a few examples now, I do n't think these things will change in the future. In this video, we will look at several different sentiment indicators and reports that are readily available to the trader or investor.
We'll also look at which reports I think are the best and why they are the best. I also want to remind everyone: if you like our content, be sure to subscribe, support the channel, click the bell, like, and, of course, write in the comments what your current mood is on the market. I also want to remind you that we have a free public Discord for investing and trading at the links below, where you can join the wider community of traders.
It's great to see hundreds and hundreds of people coming from this YouTube channel and our previous works to join the discussions. Let's start today's video by talking about the Fear and Greed Index. What emotion is driving the market right now? This is listed at the top, and that's a good thing, as it collects a lot of different information.
We are now at the level of greed. It seems the previous closure was also on the greed level. We have an indicator of 62— greed. We haven't reached extreme greed yet. But we see a path from fear to a neutral state and to greed. That's where we are right now for all these different reasons. So, one of their indicators is the demand for "safe havens." I find it appropriate and certainly worth paying attention to.
Next is the put-call option ratio. We'll talk about this in more detail in the video, but this is something I would look out for . The market coverage indicator ( breadth) is quite good. Again , I don't think it's strong enough to use in investing. Market volatility or VIX — we'll talk about this in more detail later.
Demand for junk bonds. You can almost write it off , given the Fed's actions. But now he is neutral, not full of fear. And this, of course, is due to the actions of the Federal Reserve. The strength of the stock price in general, well, of course, it will grow with the market. And market momentum is good too.
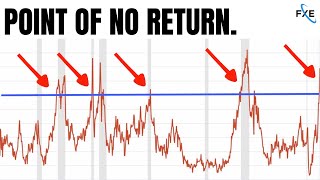
I like this little graph at the bottom, which shows the fear and greed index over time for this metric. I want to highlight with arrows the moments when the indicator drops to 20. When you talk about long-term investments, let's say you have saved $20,000 and want to invest it, but you don't know when.
One of the best ways to invest in the long term is to buy on dips. Everyone knows this. Why not just buy on the dip? It is very popular to buy indices such as the S&P 500 or NASDAQ if you don't want to choose individual stocks. Buying on a dip can be one of the best ways to enter the market. What if you used sentiment, or moments of extreme fear in the market, to determine investment periods?
It turns out that there were market downturns in 2018, 2019, and 2020 . It may not seem like it now , but there were downturns. And at all these moments, this fear and greed index dropped below 20. And then, of course, it skyrocketed. You can set a level, say 15, and when the index is below 15, you start considering the market for investment.
This is actually an extremely simple but very sound concept that you can use in the future. But let's explore more possibilities with this idea about moods . The first is the put/call option ratio for the S&P 500. I mentioned them a little bit and I firmly believe that when people don't believe in something, it usually happens.
Right now we're still looking at...I thought we'd see a little bit of a lower reading yesterday, but I'd like to see stability for a few days in a row. So, last night it jumped to 1.76. And the closer this number is to one, the more likely it is that everyone in the market is optimistic. So, the closer this number is to one, the more “ bullish” the market is.
And that usually means you should worry about the market because everyone is set up the same way. Remember , it takes two to tango . You need both buyers and sellers, bears and bulls. You need both sides. You always need opposing views, especially now , given what we're seeing in the markets. What about investor sentiment in the US?
This is another thing you can learn on ycharts.com. I don't think that's useful. This shows sentiment over time, but I do n't know how a trader or investor can use this. In my personal opinion, this is not a very good investment tool. So we'll skip that. What about the VIX index? Well, the VIX is definitely worth paying attention to when it comes to investing.
Of course, the higher the VIX, or fear index, the greater the volatility will be , and you should be prepared for that psychologically. If you enter the market at a VIX of 80, be prepared for your shares to fluctuate by 5–10% each day. These are just crazy numbers. It is significantly lower now, but it has reached the 200-day moving average on the daily chart.
It fluctuates in the zone between 25 and 30. Overall, there is still a lot of volatility in the market. You have to take this into account because the average is much lower, usually in the range of 12–18 to 20. So it is still significantly higher than the average, which means that at any moment the situation could change and we would see a surge in volatility.
What about another sentiment indicator —the bull percentage index? Can it help a trader or investor decide whether to enter the market? I think so, but again , it is important to define acceptable limits. Perhaps your limit for this index is to not enter until it falls below 20. Note: during the last two pullbacks, before 19 and during this current crisis, the values fell below 20.
Using 20 as a threshold, you will not fall into the trap of trying to enter at 24 and missing the bottom. Will you be able to get 13? Unlikely. Will it be possible to get 2? Most likely, no. But you can never catch the absolute bottom. If you could do that, you would be a genius. You should focus on averages.
One thing no one thinks about in the stock market is that it is not rigged, but is precisely tuned to grow over time. When you factor in inflation, the economy, growth, the monetary system, you name it, stock markets are designed to go up. It is important to maintain an optimistic attitude most of the time, and only about 10% of the time not to do so, because cycles last about 8 to 10 years.
There is usually a pullback in the cycle, and then we get another 8–10- year growth period. And this is exactly what has happened throughout history. And in the long run, it's better to be a "bull" than a " bear." So why am I making this video today? Well, obviously we have incredible moves in the markets, incredible V- shaped recoveries on the NASDAQ.
The S&P 500 continues to make new highs . So what do we see in sentiment? And what will make the market fall, or what will make it continue to rise? We've talked about this a lot on the channel, but let's delve into other things. Now I'll talk a little about Forex. I haven't done this too often since we got a lot of followers, but Forex has been and remains one of the tools that we believe helps people learn about markets and sentiment.
It is known that many people lose money, of course, when trading Forex. And there are all sorts of reasons why this happens. So what do we have here? Well, we have a whole bunch of different currencies. Many know that at this stage the ECB has introduced full-scale stimulus. And what does the general crowd of retail traders do?
What is the general sentiment on the Pepperstone platform? Well , if we look here, it definitely doesn't look very optimistic. Look at this Euro/US Dollar pair. 29.7% in long positions, and the rest, over 70%, in short positions. So what does currency do? Of course , it is growing. Most people lose money because they fight the trend.
There's no point in fighting the trend. If you fight the trend, you lose . So I'm always interested when you look at price action or at resistance or support breakouts. There was an incredible breakdown of the resistance level here. Even if you are not a technical trader, I think everyone will agree that the price was trapped in this range.
The price broke through it, and this brought a “bullish” momentum. Was there a fundamental reason for this? Of course, there was. But the price also showed you that. Then people struggle with this urge to buy. They don't want to buy. They want to sell because they believe the price can return to the lows or even lower, because it has happened before.
Everything changes in the market . You have to be flexible, and Forex teaches you exactly that. So the reason I wanted to introduce everyone to this sentiment indicator is that no matter what currency you are looking at, and what direction the trend is going, you will find that the sentiment of the retail crowd is the opposite.
Let's take a look at the US dollar/yen pair. So, dollar/yen, another impressive break of resistance. What happened to the sentiment towards this particular currency? Well, if we load the sentiment indicator, we will notice that only 36% of people are long on the yen, and the rest of the traders are currently short .
This shows that the retail crowd has no idea how to trade this currency because you should never have been short during this entire move. And I can tell you that at some point 80% of people were wearing shorts in that area. So, in this area, approximately 80% of people were wearing shorts and, of course, only 20% were wearing long pants.
The same theory can be applied to markets. So let's just look here. Here we have a report on IG client sentiment . It turns out that only 23% of people trade CFDs in net longs, while 77% are in shorts. So, if they are all shorting and the stock market likes to take money from people and never turns around until the sentiment changes, you really need to wait for the long-short ratio to change.
And I think what I'm getting at is that no matter what, unfortunately, the least experienced investors , i.e. the retail crowd, do, there's no doubt that the market will generally do the opposite, because again, someone has to win and someone has to lose. There are contrarian investors who can make good money over time, but realistically, you're better off following what Wall Street tells you .
And this is very important. So a lot of people ask us, "Well, how are we also going to recognize a trend or any of that stuff?" If you don't understand price dynamics and want to use, perhaps, moving averages as a sentiment indicator, they show what's going on. Another advantage of moving averages: if you use a 20- day exponential moving average, you may notice that when the stock market makes big aggressive moves, like what happened here with Apple on the daily chart, when it retraces to level 20, you get an opportunity to buy at a slightly cheaper price.
If you want to hold Apple stock long-term, this could provide you with that opportunity. Of course, sometimes better opportunities come along, like recently, but in general, if you want to get in on an aggressive move, moving averages will help you not only identify sentiment but also find an entry point.
More about this on the channel. So subscribe and hit the bell to learn more about these things in the future. We will cover them. What about COT ( Commitment of Traders) reports? I keep hearing a lot of people talking about them. Are they useful? Well, here's the thing. Almost not. The COT report provides open interest data every Tuesday for markets where 20 or more traders hold positions, etc.
Schedules are updated every Friday at 3:00 PM. This is a late statistic . She comes to you a little late. Can I watch them? Of course. Will this help you? I don't think they are as good as other reports. They are interesting, you can go to barchart.com to look at the COT reports, it is worth investigating, but I think other indicators are a bit better.
Remember, we talked about having a clear plan, using these mindsets: when others are afraid, you can be greedy, and you can do it over and over again. So, to sum up today, which of these indicators do I think is the best? It will probably be a mixture of several of them. CNN—be sure to watch it when it's below 20.
It's worth watching the put/ call ratio when it's low and the market is extremely high—that's when you should be most cautious, as Buffett would say about market behavior. The VIX is great, but it shows spikes and doesn't necessarily show where we are in the market. As we saw recently, 80 is a very high number.
Did we think 80 would happen? No. So VIX won't help us much there . And the best indicator is probably still consumer sentiment in retail. If you are trading forex and see a breakout to the upside when everyone else is selling, that is a crowd of retail traders and you should be happy because they are unfortunately losing and you are moving along with the big money.
So, this is very important to consider. If you liked this video, be sure to subscribe and click the bell. Of course, like it , write in the comments about your current market sentiment, and let us know what you like the most about it. And of course, we are looking forward to reaching the 10,000 subscriber mark.
We are grateful to everyone for their support. So head over to our Discord, join the community, and see you in the next video. Thank you all, successful trading. See you later.



Comments 0