
저자: FXEvolution · 외국인
요약 보기
연준·ECB·BOE 발표와 미국 GDP, OPEC 회의가 몰린 24시간을 앞두고 변동성 경계를 강조. 기술주로의 자금 유입이 보이지만 최근 2주간 로테이션은 되돌려지는 모습이며, VIX 28대와 2년물 금리 상승이 증시에 부담. S&P500은 4000선 저항·갭 충전 가능성, 나스닥은 하락 추세선 아래 약세, 비트코인은 횡보 대기. 금은 1820달러대 지지 확인 후 1830 돌파 시 상승 가능성 언급.
다듬은 글
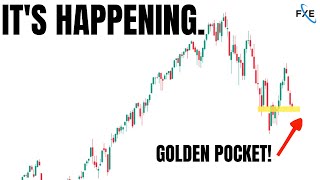
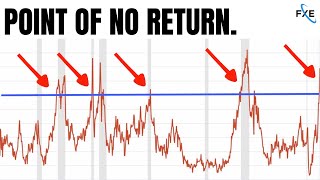
hello everyone and welcome back well it's not often that we say there's big news around the corner but yes there is unfortunately we have three central banks coming out in the next 24 hours with the ecb the boe and of course the fed coming out with announcements but on top of that there's even more the final gdp number for the us and also the opec all-day meeting so of course possibly be wary of oil trades over the next 24 hours in recent movements though in the market the markets chose to really give up some of the big rally that we've had so far they moved down after spiking higher in the morning and went all the way back to where we have one of our most important gap zones funnily enough it's going to be sitting around this area ahead of the big news especially the speeches from the central bankers so if the market decides to boom where's the next stop most likely somewhere around this 4 000 for the s p 500 funnily enough a lot of options sitting there this week which we will discuss in today's video but there's so much more under the hood of these markets including rotation and many other big macro figures that we need to be looking at so join us as we go through all of that right now see you soon this will be a good one if you like any of those markets please remember to subscribe and of course smash that like button if you find value in today's video let's talk about the big tech inflow no surprises to anyone that's been following the channel we've been following this rotation now for two weeks but it's showing up in the charts and what this really means is basically wall street has decided that tech is cheaper in comparison to some of the other sectors in the market of course 2022 so far has been driven by things like oil commodities inflation all of those stories but they've took a bit of a hit in the last couple of weeks while we've seen massive inflows into some of the big tech companies and i think that really is due to some of the things that we're seeing such as ford p e ratios getting a little bit cheaper if you have a look at this chart over time you'll notice that the ford p e ratio that doesn't necessarily mean it's cheap by the way is sitting underneath 16.
now if we go back through history this is kind of like you would say like a middling zone for buying technology stocks or in general buying stocks in the market because this is a bit of a zone basically people are starting to pick it up and that means that larger funds are starting to move a little bit into this saying you know what the risk reward is starting to look a little bit better would they prefer of course a 14 or even a 12 of course but that being said they have to put money to work at some point and we saw that in the quarter rebalancing as well so yes back down to 16 here four ford pe projections some worrying things now in the economy what are we starting to see happen well no surprises yes we know that there's been a strong jobs market in the us but that's starting to weaken and it's showing here with tech layoffs that i did tweet today on our fx evolution on twitter handle you can see here the big tech layoffs that are starting to occur high profile ones that we've seen recently have been things like coinbase and tesla but they are starting to mount and it's not just one company in tech that is firing staff it is many and expect this to continue to rise as we go through the rest of 2022 and it shows that that number of course which is a lagging number the jobs number may be starting to look a little bit dodgy in the next couple of months as we see it release you to date averages of investors and retail traders actually investing in this is a s p 500 chart over the top of retail daily net inflows and what you'll notice is that retail often do get it wrong recently they've been buying pretty strongly and it's actually picked up relatively okay but yeah look at this big spike over here huge amounts of retail investment what happened straight after that well down we go and i think that was around the fomc meeting and of course it traps a lot of people it just shows you that if you could see this data real time which will be trying to bring some more of that to the channel over the next coming months so definitely subscribe for it it gives you a big edge to know what retail is doing because the street technically likes to do the exact opposite another thing that's really interesting is etfs versus single stocks now i did a bit of a poll about this on the channel and we found that most of you have pulled in your individual stock purchases and trades and you're starting to move more towards the s p 500 nasdaq russell all of those types of things currencies and metals well that's actually a pretty good decision but it looks like a lot of people have done that since october 2020 where we saw that really huge spike in single stock picks and those types of things we've seen that really compress and now more people have comfortable with things like the s p 500 nasdaq and others which definitely makes sense in these types of times on the more positive bit of news and i think this needs to be followed we've got two big bits of news the first one is china actually started to lower its restrictions on covert now as we know that's a big supply problem the one thing they did there was it's not a big one but they changed it from three weeks isolation to ten days in the future if we continue to see them rolling back some of the covert policies that's going to be a bit of a bull sign for the market so this isn't enough yet but do watch that story i check it daily and i will bring it to you on the channel if we see it turn around it's going to be a very big story if that occurs and expect the market to like it quite a lot i think supply is the biggest issue we're facing in these markets speaking of supply container freight rates are coming down steadily really showing us that we've probably seen the peak in some of the inflation in the markets and this is why we might expect u s two year and ten year to turn around as well in terms of interest rates and we'll talk about that very very soon now let's look at the last 24 hours in the market this is from the market closed 28th of june 2022 and you'll see it was tech that was actually getting rotated out of on this particular day and this is because while all of those numbers show rotation into tech we saw it what two weeks ago we saw the comparative bit we saw the bullish movement now all of a sudden it was time for them to reduce that position as they await the big news coming out of of course the fed's mouth the ecb and the boe nasdaq was down three percent the rest were down around two and they rallied slightly in the morning and then fell all the way through the session this meant that things like technology clean energy xly which is consumer discretionary were the worst performers and the only good performer for the day ended up being oil and utilities it's just behind that another defensive day here with most of the defensive plays such as xlp consumer staples and others holding up better another thing that we've seen recently is being the vix and what's been going on with the vix now if the vix has been really high or the fear index has been really high we've tended to see that being a bottoming effect i've said for a while around 35 vicks has been very very solid this year and we've been following that here on the channel but here's a great chart that i think can help a lot of people just to understand that when fear rises up to a very high level often that can be the point where we're seeing bottoming and you start to look for bottoming bases on your charts and of course we do that together here on the channel all the time speaking of vixx where are we 28.36 so no not a 35 and certainly not a 25 but it did spike due to the decline in the markets in the middle of nowhere at this point nothing much we can get from that bit of information in terms of two year versus tenure these are the interest rates the treasury yields moving forward we saw the two-year spike up a little bit and then slightly decline after hours you'll notice it's moving down a little bit as we speak at the time of this recording but if it doesn't come back down fairly quickly it's not going to look too good for the market remember the market is very sensitive to this as we saw two year rates go up what happens to the market it goes down two-year rates go up what happens to the market it suffers so we do want to notice and definitely pay attention to this very important factor in the markets basically if the two-year ends up going up more and the market's holding that might be quite false and at this point we will be paying attention to that we'll bring in the pcc as well this is the call ratios sitting at around one we're not at an extreme level either side so we can't get too much information from that but we did have some requests for people to look at it at the moment pcc sitting right in the middle let's now talk about the us dollar were we seeing people move into the us dollar the answer was yes it actually broke this little down trend here that i did cover in the private stream yesterday if you're ever interested in that you can check out the free seven-day free trial down below but basically it it broke this and it started moving up it is technically still in the downtrend on the small time frames like the one hour and a few others though yeah it's it's not really clear and i think that if you're a us dollar trader it's kind of at a point where you would expect it still to sell off here it hasn't made new peaks over these last kind of ones that are sitting here here and here but it's not clear and i think that's because of the news i would wait the news that is the fed the ecb and of course the boe and once that comes out we should get a clearer picture from that similarly gold is struggling around the same zone that we've discussed recently it's basically just holding as best it can around the 1820 it is holding against the us dollar which is of course this is gold versus the us dollar but it's not really doing that well and for it to to really start to play the game one of the big things that needs to do now is breach this level here 18 30 in the next 24 hours something like this and then it breaches through a little bit of a pullback after that should be a pretty nice long from a technical perspective and that's the type of thing that i'm looking at remember everyone on this channel we always read it out patience react don't predict sometimes you don't have an edge in market sometimes you do it's your job as a trader or an investor to find your edge to find when you have the greatest statistical likelihood of success and then move from that why would this be a big trade because it would be breaching through a supply zone on top of that you can see these wicks here big rejections so if you breach that what are you doing probably putting the squeeze on some orders sitting behind it a very important concept and something that i always take with me every single day into any trade or any concept out there an investment tesla was pretty weak in the session it didn't continue on the way we thought it may never made the new high unfortunately we couldn't breach and move into this level here the thing with picking individual stocks right now which is what we brought up at the beginning is that it's quite difficult and why is it difficult because when we're in a high vix environment it's really more about the u.s 500 the s p the nasdaq the iwm the russell all these things picking individual stocks is just more if you see the s p 500 breaking out to the upside you know where its next stop is guess what you come in you pick tesla or you pick you pick another stock those stocks will often do better percentages but really they have to be driven by the main index actually breaking out that's not what we saw in the previous session that's why this is going to look very similar to another one that we'll check out soon if you're wondering where's the support here for something like tesla well it's most likely down and around this area here about the 690 and that would be consistent with filling the gap on the s p 500 and then hopefully looking towards that recovery kind of play to get us back to the 780 which is a huge resistance and we'll talk about that should it happen xly xlp confirms our suspicions of the last 24 hours which was that we are seeing a little bit of tech sell-off go back watch our previous videos on this this is a great indicator for showing us risk on a risk off and if you actually zoom it out on the markets you'll notice it's been risked off all year only with small risk on sometimes for the technology stocks and this is how we're determining that the rotation is occurring as it's happening rather than after the fact russell 2000 still has left two gaps now depending on how this whole speech stuff works out we might be able to actually get a bit of a rally here but look with the russell we've got the long leg doji we've got a sell-off obviously not really living up to expectations i would expect however if the market does start to go bullish it's possible the russell will outperform both the nasdaq and the s p 500 in its recovery let's move over to the german market here the dax just have a quick look at it huge amounts of rejections here very bad looking chart just frankly looks terrible if it does get through though and you are feeling bullish and you want to react not predict wouldn't this be a huge squeeze i mean we now have three supply style candles three rejection weeks here if you breach that what are you doing again you're putting the squeeze on and that could be quite a strong trade at that point but at the moment i mean it just looks mostly bearish here on the chart in line with of course the declining market pretty important 24 hours here for this one i'm going to be interested to check that out in the next 24 hours on the charts with all of you out there so let's now take a look at the one that most of you like to trade which is the nasdaq we had the downward trend line here it hit that downward trend line pretty much filled the gap here on the upside though not quite it didn't quite get there and then it sold off to fill the one that it's left down below so the nasdaq was technically the best short signal that we got in the last kind of days and we did have it here but i like to use the s p 500 as much as possible it fell off pretty heavily it's back down to now a support level so around that 11 550 previous kind of nice holding pattern area for it and this is where the news will most likely come out and where the movements in the markets need to change we use the s p 500 to really detail some of the key levels so again the downward trend again where that level hits is about four thousand we did leave behind a huge gap here on the s p 500 that was left from the friday rally and it makes sense to come and fill this now generally speaking this is one of those days that you look at you think what a good day to potentially be day trading if you see reversals here in your systems if you see strong pickups it's in line with the current inverse head and shoulders it's in line with the current concepts in the market and even in line with some options that we'll take a look at the moment so what do you think this is an area that i think a lot of people will be watching waiting having the patience and then trying to react to some kind of pickup off this zone if it then breaches through here and ends up getting underneath 37.50 though not going to be so good for the market here we move then all the way down to the gap before the island and whether we reverse off this point will be a question we have to ask ourselves in a later session i doubt we get there that quickly if the markets do end up going below any of these points though the biggest cleanest area to be looking at is going to be the 200 weekly sma and the 200 weekly sma is going to sit smack bang on the 3500 we've done it plenty times on the channel but basically it sits right on 3500 at this point which just so happens to be the previous resistances on the way up through this market so remember at this stage it's still theoretically bullish on the smaller time frames such as the one hour we still have the series of higher highs and higher lows and until that's taken out we can't be sure that the market doesn't want to actually ball through this area as it fills some of these gaps so that's something that's definitely going to be on watch now for the next 24 hours us 500 at the time recording you can see here i've just marked up the gap you can see where the market currently is it's trying to do its best to hold through this area and i just want to point out this little distribution that we saw it turned out to be distribution though it was like you know just basically a coiling market we had a market that made a peak came through made a slightly lower trough and everything was looking kind of bullish into the session it goes through and then instantly reverses if you ever get triggered by these things always ask yourself this question if you get triggered and then automatically it just goes backwards we've all had that and it ends up reaching below what it's done is it's trapped you it's done a good job of trapping you into the trade the best thing to actually do is to say ah it got me well done mr sneaky market you've done well there and then what you can do is you can actually look to the reversal the most common area that it would be going to which is here it's trapped liquidity it's grabbed the orders and then of course it's reversed and as it broke through this low it was pretty obvious that it would go down to this gap range so certainly a trade that could have been there even if you got trapped oftentimes traders get scared and won't be able to pull the trigger the other way it's something that you have to just take the emotion out of and if you can do that it's a big game changer let's talk about the market in the next 24 hours as well and into the friday options expiration we now have quite a lot of 400 calls so this is for the spy moving up and that's kind of like a big resistance for the end of the week call sitting at 400 calls sitting at 390 and then of course we've got some puts sitting at the 380 area and the 370 area so they're starting to kind of show their head in terms of where the market options are 385 is currently max payne which is of course above where the market's currently trading at this stage so we'll have to figure out whether that's going to hold but certainly something to be looking at on to crypto bitcoin still sitting around 20 300 it's still right on electricity production cost bitcoin has not been moving very strongly in the subsequent sessions if it hasn't really even moved up with risk on in things like technology and it's not doing that well at this point you can kind of say crypto could be slowing and effectively you're waiting for the next level i like to set long-term alerts on key levels such as maybe 23 500 or 24 000 on bitcoin and then come back to it when those things happen because we could be in this holding pattern for a little while on bitcoin we will keep covering it but we could certainly be there ethereum versus bitcoin if you notice here we have the coiling above ethereum was outperforming bitcoin in the recovery it's now kind of slowed and you'll notice here with bitcoin it's just basically on the little bit of support that we put in the previous session so similar to the stock market it's come back to a little bit of an area it's previously been bought off this a few times will it again well that's up to of course your systems and hopefully you can find the key things that are happening underneath thanks so much for watching today guys do remember that you can follow us at fxevolution on twitter and also remember we have opec meetings today final gdp numbers ecb boe and the fed coming out 9 a.m wednesday june 29th and for the rest of the week we've got core pci price market uh index as well and really that's the big bits of news that are coming out it's going to be a bit of a blockbuster wednesday let's find out whether we can get some volatility and direction i'm sure jerome will mention the tools at least 100 times in his speech and maybe who knows that might even bring up the markets if you enjoyed today's video please subscribe smash that like button we'll see you in the next one bye for now



Comments 0