저자: 미상 · 외국인
요약 보기
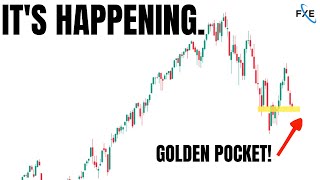
S&P500·나스닥 등이 골든포켓(0.618~0.666 피보나치) 구간에 도달, 과매도와 시장 심리(개인 약세 우세) 지표상 단기 반등 가능성 제기. 다만 중국 봉쇄, 미 국채 금리(10년 약 3.35%) 상승, 연준 긴축으로 하락 리스크도 병존. 금·원유·비트코인 등 기술적 지지/저항 레벨 제시하며 9월은 박스권 트레이딩 장세 전망.
다듬은 글
hello ladies and gentlemen and welcome back in today's video we discuss markets around the world but more importantly the key levels that you need to be watching right now the golden pocket has been reached on gold S P 500 NASDAQ and others this level between the 618 and 66 FIB is kind of rare to happen and when it does we need to be paying attention the more important thing about this though is oversold territory we've got some amazing key level indicators to show us that maybe dumb money is getting a little bit too bearish at this stage so will we have the Kangaroo Market for September the weakest month of the year will the market return and then move down or is it just going to keep going down at the trajectory it currently is join us as we try to answer that question stay tuned foreign discuss stocks Commodities and cryptos if you like any of those markets please remember to subscribe and we'll be leading up with the key macro and big information then the lead indicators the forehandle almost being seen now on interest rates in the US and the lead indicators that are pointing towards some key levels being met a significant number of stocks are now currently oversold on the S P 500 and we've reached the stochastic threshold level of 73 this means that realistically stocks are entering a period that we can start to use statistical analysis to maybe help us with an idea or a plausibility between a bounce or of course a sell-off so when we usually see this type of indicator occur it's usually in these types of diabolical market conditions that is markets that are very very aggressive on the sell side and when that does happen we can start to lead into some indicators now if we look at the one week two week one month process it kind of says here that there could be a small bounce coming and we have to be open to that idea we're at key levels of support with an oversold reading does that mean that we instantly go oh yes what a great place to buy well of course no it doesn't but what it can do is it can be brought along with other Concepts another thing that we've used in the past in this channel is of course the composite washout model signal and this is giving us a count towards the idea of potentially a small rally it did certainly help quite a lot in previous times when we saw it really hitting these levels back in the period of June and July and it's now starting to show it again so does this mean the dumb money versus smart money are disagreeing a lot of people have turned bearish we've shown the bead kind of I guess you would say surveys that are coming out from the retail crowd and over 45 to 50 percent of retail Traders are now heavily bearish and very few are heavily bullish this usually means that dumb money versus smart money is disagreeing with each other and we talk about this indicator all the time dumb money very bearish smart money starting to turn up and they've been buying this dip so far now of course they've been wrong so far but they may want to push it up so will smart money or Wall Street actually move the market up against all of this very negative news and of course the news coming out right now is very negative we've got another big story that of course we've discussed here on the channel the covid-19 lockdowns in China remember the FED is kind of killing Demand by raising rates so are central banks around the world but at the same time we have supply chain shock issues coming potentially back through in China 20.9 million people are now locked down remember this was a huge Catalyst for sell-off back in April and May but it didn't happen straight away so we saw all these lockdowns starting and occurring and then they continued to happen and we saw that big spike and of course the covert number if this does continue to happen it could be a big Catalyst towards the markets going down further and more importantly interest rates going up more in the US in terms of the forward rates we'll show you how to find those very soon how do we know possibly the bear Market is over well a good indicator has always been the 200-day moving average we've talked about this one quite a lot we hit it to an absolute perfection only a few weeks ago and it helped us to design or really kind of create that strategy which was to the bare side which is where we are right now but at this point in the future will you pay attention to the 200 I think we have to the 200 has been a great lead in previous pullbacks to when we've moved above it that being a pretty decent Zone to pick up markets now of course there's always an exception to the rule here and here we're certainly very bad but if you can stack it with other reasons it can help you to make better decisions let's get into the charts now and we'll start off here with the vix the volatility index and you'll notice straight away the vix back to almost 27 on the reading a new high for the last session with the new low in the S P 500 during that time does it tell us much not really we're neither Nia of course kind of like the greedy area of being in 20 and we're certainly not at the maximum fear level yet of being around that kind of 35 Plus on the vix usually correlated with extreme highs and extreme lows the US tenure though has been going up so these interest rates are starting to get pretty high U.S tenure at 3.35 versus of course things like the five year at 3.45 and the two-year at 3.5 so the two years on a new high the 10 years catching up very quickly and the biggest most interesting thing is what's happening with the Ford yields here is the yield for April of 2023 we're almost at four percent now if this ends up coming to fruition it's kind of the worst case that a lot of people are looking at now we've long speculated that the US cannot push interest rates past five percent as it would basically be the straw that breaks the entire monetary policies back of course the FED would be pushing rates so high that the US government and other governments around the world may struggle to even repay their own debts but four percent this is a huge level and with something that we will need to be watching let's move over to the US dollar what's happening now well with rates forward rates raising or Rising we're seeing strong US dollar it makes perfect sense if you start to see yields in the forward projections start to fall then it would make sense that the US dollar will also weaken at the same time let's take a look at this four hour though notice the rejections that have come off this zone so far two rejections off this Zone a new Spike and it hasn't actually closed above this area now what's more important is the Commodities against the US dollar and how they're holding so let's actually scroll over here to Gold Gold's in the golden pocket now what a what a great time for it so of course it's pulled back now after reaching some seriously big levels we've gone over here and we've gone to basically the 1726 now this was a huge level of Supply there was a lot of previous support becomes resistance but also previous Supply and the market hit that and rejected it remember in our previous videos we've discussed the idea that this was the critical Zone that we wanted to see the market take and then pull back to allow bullish entry well we're very close to basically the zone that most people will be focusing on I think a lot of the bigger Traders will be looking at this level and saying if they're committed towards gold they've kind of got to start to think about that commitment now from a technical perspective the golden pocket a movement up to supply a break of the previous 17 10 1711 Zone all of this is pointing towards a little bit more strength coming through if we go to the Daily you can see that we're also at a critical level of previous supports being found through all of those other zones in the past it's similar to U.S oil U.S oil is at cracking point you'll notice here 86.74 Barrel now I'm kind of weak on oil over the longer term that is the next three to six or even 12 months I've said that all the way since really 125 per barrel and it's at 86 do I like this level well you can argue that it's support and if you believe the US dollar is about to weaken or something that like that will happen which we have no indication really yet that it has then you might like oil at this Zone I think I would like it to break through these levels first as in like create some kind of doubling bottom strategy to go towards the long but at this point it's at Key support and this is the third or fourth test of this level so we'll see how that works let's move over to the stocks now though and the first up one is Tesla well Tesla actually closed relatively strongly 1.56 percent up with a little bullish hammer in the previous session and what this shows you is the rest of the market was weak but Tesla managed to hold the low and that's really big thing because of course if it gets follow through in the next session that could really push Tesla to potentially creating a little double bottom underneath that overall larger range that's here now we still have the Gap under here I think we need to be very wary of in the future and even any rallies that may happen here in stocks there's a good chance that there's a sell-off coming sometime later remember we're at the beginning of the worst month of the year being September but Tesla on the small time frames is starting to look a little bit like a potential turnaround key levels in the next kind of day will be somewhere around this kind of 280 Zone and you'll want to see a new high being formed above 276.
let's move over to the Dax and have a look at that one well of course the Dax is on technical support this is good because it's going to coincide with all the other markets we look at soon the Dax is moving to that 12 500 previous support previous support demand and we're back in there at this stage now the Dax isn't giving us the good indication but the other markets are and this is where things get really interesting golden Pockets everywhere guys this is the one so we've got here resistances we've got of course the 618 66 FIB of the entire move so far and all of these zones coincide with so many key points it doesn't mean the markets have to hold of course they could fall straight through it that's the nature of markets they can do so but we're about to see whether it can do it most likely in the next 24 to 48 hours of trade and we'll explain why when we look at the S P 500 from a technical level but exhibit one will be the Russell 2000 on that golden pocket let's have a look now at the NASDAQ again a very interesting Zone still net bearish of course the trend is down there's no doubt but we're hitting a zone of previous resistance previous demand or support and again the golden ratio here the golden pocket 61 8 to the 66 a very important zone for these markets and really a weakness here could push us all the way back down to these previous demand zones around 11 500 so you're really looking at a fairly significant drop should the markets actually be able to falter here and go through let's have a look at the smaller time frames now for something like the NASDAQ and what you'll notice is that when we actually Zoom it out it's kind of made a new low underneath that twelve thousand we ended up going down to 11 930 and we haven't quite rallied Above This level here this is what was formed on the Monday side of the market or the Tuesday side of the market in this case twelve thousand two hundred ish Zone interesting if the market comes above that you would suspect it comes back down to this very key area and then finds bullishness and that's how close we are we're on like that knife's edge of bullish versus bearish kind of tensions the market currently You could argue is making like a little tight kind of pennant here or symmetrical triangle maybe a breakout would be a good sign for the markets in general and a breakdown well that's not going to be too good it really needs to find support pretty much here otherwise there's further weakness that could certainly be coming through again the S P 500 showing us the signs of previous resistance previous support previous support the golden pocket all sorts of things going on here and the small time frames will again show us a very similar story and this usually is the better one the S P 500 leads the way and if you like the Russell the Dow or of course the NASDAQ then you can follow along with that 39.60 a brand break above I pull back down to something like a 3930 and of course a movement up can this technically happen well if it does it does Point towards a potential little bit of a pivot shift for the U.S stock market and of course that's going to be so important for Traders out there because when we look at these markets we've been in a fairly significant sell-off now for basically what about almost two to three weeks now up here beautiful 200ma of course we had so many great reasons to be shorting up here and every time we've taken out these key levels we've moved down to the next one now that we're at this level though could we rally well if we rally heavily the next rally points could be all the way upwards of 40 90 or even 41.25 which just so happens to be one of the most important levels through this entire Market condition so 41.25 is going to be a big one follow along on Twitter as well I have been posting a little bit there with some key levels at least technical levels to be looking at for the week ahead and you'll see them over on our Twitter handle at FX Evolution how does this work with the current put or call walls though do we have any inklings at the options Market is helping us out well firstly it's not a third week expiration it's not a key options expiration so therefore the options volumes are down quite a lot 70 000 isn't something that's very interesting but coming into Friday technically the Max Payne would be at 400.
it's currently trading well below that of course stock price at the end of the close around 390.69 so there is a really good chance here that the next couple of days bring us a rally options are kind of pointing towards that side of things and if the markets do indulge that then there's a real chance that these markets do go back up of course with the S P 500 if we fail at these levels and we can't hold that kind of golden pocket range the next area could be as low as 37.50 so we've got to be very open to the downside as well as the bullish side it's going to be a Trader's Market here over the next month kangaroo style could be the way we're looking Bitcoin is kind of front loading the weakness so if the rest of the markets are anything to go off Bitcoin is incredibly weak right now 18862 it's taking out all of these liquidity areas here it could seriously bounce if the stock markets do well but of course underneath this low here this very dangerous level if we end up getting underneath that zone and that equals around 17 600 ish you've got to Look Out Below I've long thought about this for Bitcoin and whether we're obviously in a crypto winter but whether we can make it back down to some very key levels the 11 000 or even the 9500 zones and if we get under 17 5 or 17-ish six anything's possible and you've got to really look at time in crypto can fail even when the rest of the Market's doing well so this is a pretty weak looking market for some people they're going to see this as an opportunity to look for quick reversals and it could be there in the next 24 hours then crypto is going to be wild over the next couple of days it certainly looks like it will be for the next couple of days there's big economic news as always there is there's nothing we can really do about that Thursday September 8th we've got ECB press conference and then we have Fed chair pal coming out as well not soon afterwards so basically we've got two big big big bits of data we'll find out whether this is going to move these markets and then leading into the end of the week we've also got some employment and unemployment numbers coming out for CAD so it's going to be a pretty big week but realistically it's just a big week because we have a monstrous support can it hold can the Bulls get through we'll find out as we said follow us at FX Evolution join our Discord Community if you're interested as well free seven-day trial for the private or of course the public we have that with over 10 000 members in there so come and join the community and as always we'll be a little bit patchy this week as I am on my honeymoon at the moment but we'll be banking content when necessary so thanks so much for supporting the channel subscribe if you enjoy the content give it a like and we'll see you in the next one bye for now


Comments 0