
저자: 미상 · 외국인
요약 보기
미국 주식 공매도가 2008년 이후 두 번째로 큰 규모로 나타나 숏스퀴즈 가능성을 언급. 경기침체 확률 60~70%로 보며 2년·10년물 금리 역전 재확인, 달러지수·금·유가·비트코인(채굴원가 이하) 기술적 레벨 분석. S&P500은 3,500 부근 하방 시나리오를 제시하고 반등 가능성도 열어둠. 단, 본인 의견이며 매매 권유 아님을 명시.
다듬은 글
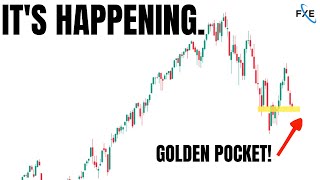
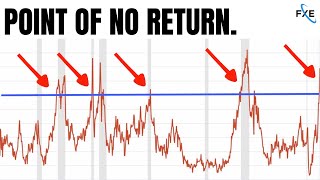
hello everybody and welcome back well it may come as no surprise to many of you that we have just witnessed the second largest short selling period in history since recorded history back in the global financial crisis markets across the world have fallen off key levels we've also got crypto such as bitcoin moving below raw production cost which we'll be taking a look at later and everybody is pretty fearful but where a massive short happens usually that's passed by some type of thing such as a short squeeze so is it time to do the short squeeze now or are we moving to the fable 200 simple moving average stay tuned as we go through the markets for the week ahead right now see you soon everyone this will be a good one daily if you like any of those markets consider subscribing and of course give us a thumbs up on the video if you enjoy today's content and find value in it let's talk about this prime book us equities of course the largest short selling for a very long period of time as the data's come out we've ended up seeing the composite man or wall street short selling at a rate that has only been surpassed one time in recorded history during the global financial crisis you'll notice down here all the way back on this chart anyway we didn't see a point that was any larger in terms of general short selling now wherever there's a great short sale there's usually a potential for a great short squeeze so that is squeezing and short covering notice back in the previous history with the lowest one that we've got here on recorded history we see a subsequent squeeze that occurs now that doesn't mean that the market goes off and goes to all-time highs or any of those types of things but certainly it brings in the stats and brings in this idea that there's a chance that there might be some covering in the next week to two weeks of trade and of course technical analysts and people that are in the markets want to be looking for these types of information these types of things coming through now it doesn't mean that insiders or people in companies weren't buying of course we did see insiders on certain metrics still buying their stocks at a pace that has been faster than before but this is the pure hedge funds the pure market manipulators out there getting involved in the market so after a good period of manipulation down what do does wall street tend to do or the composite man well i would like to focus on a few things here this is some of the periods that we've seen peak to trough declines of over 20 in the s p 500 you'll also notice time from peak to troughs seven eight these short ones three three three and one now whenever it's been a really short period of incredible selling we often do have one month three month six month re real movement towards the positive after that so you'll notice here we have some decent little kind of squeeze runs that end up giving relatively good percentage over that period of time another thing that we want to be focused on is are we having a recession are we in a recession in the next subsequent 12 months most metrics are pushing towards 60 to 70 chance that the us is going into recession and of course the bond market while it hasn't hit my favorite thing to see in the markets at this stage which is 50 of all yields inverting make sure you subscribe because we will tell you when that happens and we haven't seen that yet so it really means that the bond market hasn't told us it's inverted on the two and 10 year which is very important and we'll look at that in a minute but it hasn't shown us everything that we'd like to see usually from a pure recession standpoint if we think about speed at which the markets come down and put it against other subsequent bear market periods it's pretty fast in terms of the average and you'll notice that if we are not in a recession this has often been where the market has tapped out and said you know enough's enough this is not a recession and it's turned around of course we don't know that whereas in other times recession in subsequent 12 months you'll notice even the speed here has been incredibly aggressive when compared to other markets now you might say well this is because of the asset bubble the huge asset bubble that the fed has created of course the speed at which the algorithms are in this market the speed at which the data comes out makes it faster i do agree compared to average that makes sense but we do often have these kind of relief in both situations we have these relief periods of either whip saw accumulation or of course some type of rally that can occur around these periods of time now what happens at the end of the year and the subsequent next six months that could be totally different remember we're still in a midterm year and we're not even talking about the midterm elections which tend to create volatility in the market regardless but interesting where we're at the time we're at and of course what the potential is here of a squeeze considering the massive shorts that came into the market let's talk about a few other things that we want to see turn around before we say okay yes this market is finding support it is really finding buyers one of the things that you always look for is things like this which is the two-year obviously this is very important to the market if the two year goes down and starts to actually stabilize in terms of declining that can be a positive sign for the market the market hates the two-year and if you think about it and you load up the spx over the top and go to something like the daily you'll notice that the market has really subsequently not done well during these periods of extreme two-year runs when the two-year stabilizers the market can therefore also stabilize and potentially have little runs up and of course if it goes down look at that correlation there very good correlation something that you want to be considering on your charts moving forward us two year versus tenure we talked about bond yield inversion obviously we're right on it we yield inverted twice now this is a usual sign of a recession coming in the u.s we've talked about it a lot we've said this is the one of the most important things but i also want to see 50 of all bonds inverting for that to be even more clear so let's talk about the us dollar a lot of people don't know but the dollar can dictate during times of fear this is the of course the dollar index not really the real cash dollar it shows us the flow of money around the world and whether the flow of money is risk on or risk off in terms of these markets to a degree and we had a massive breach the other day which shorted the dollar then it rallied back up obviously trapping people into a serious buy and now we're at ahead of the u.s market open a super critical zone effectively if the market gets through this area it's change trend towards the downside it's already got a monstrous change that happened here and nothing has really happened other than at this point you would be saying okay it looks like the us dollar is shorting now because of the squeeze that we've seen or the potential squeeze that we're going to see of course shorter is coming through covering up and now moving towards the long side potentially could this coincide with something like that this goes down shows us that money is going back into bonds back into the s p 500 and into some of those markets we'll move over to the gold market as well if we scroll down to the one hour i've been pretty bullish on gold here for a few weeks and i think rightfully so we've obviously got some key points here coming into the us market a defended zone sitting around that 1835 area this is an area that is very critical for the bulls to hold and if they fail to hold in the next 24 hours next up 18 20 18 15 so you don't probably want to see that however we get a bull buy what a lot of people look at this as a double bottom of course i think it's already looking relatively good hopefully it continues to go that way and we move towards testing this previous supply area and if we breach that then of course we could be going to some serious numbers here for gold a lot of people are starting to get excited for gold gold can't really do well until the us 10 year and two years start to drop that's kind of like almost prerequisite i know it doesn't make sense to a lot of people but believe me it is a correlation out there with uh lowering yields is usually a good thing for gold us oil big drop off ever since we discussed this change of trend that happened up here on that one hour we're breached underneath the defended area a super critical point here for oil it's dropped and pretty significantly fallen off it's now in a massive consolidation range why it's ahead of the us market the us market hasn't opened yet we cannot get the idea of whether it's risk on or risk off you probably want to see oil dropping a little bit more if you're bullish on markets at the moment if oil goes up of course that means that we've got problems in terms of inflation and oil is not usually a great thing to have going up in a time of where people are feeling a little bit poorer and of course the gallon cost everything like that is too high so very big consolidation this could be accumulation for a breakout or it could also be a massive distribution short whenever you get a market tending to hold like this it usually means a coiling effect with a big move set to happen so of course the breach here will be a very important trade and concept over the next couple of hours before we get into stocks i just want to talk about a super interesting concept and this is bitcoin in comparison to production cost and of course electricity cost so bitcoin fell underneath just its raw electricity cost at the current parameters of difficulty for mining it so that means all the miners out there are making zero dollars or very basically nothing on getting their bitcoins created and that's not including in total cost just the electricity cost this hasn't happened many times before where it's fallen through this range and usually what has happened is that there's been a slight difficulty change that happens but this is crazy stuff so bitcoin is now cheaper to buy than it's actually cost to produce just from the pure electricity standpoint and this of course can mean that either bitcoin is completely failing or another thing is bitcoin is in a zone where maybe some whales might want to come in and say hey well stop slow down right there guys we want to of course pick it up we saw the market go all the way to 17.5 that was pretty critical and if we move over here and i just load up a bitcoin chart i'll just show you how you could get a level like that and kind of come to those conclusions if you go to the daily you'll notice there the 17 kind of six level there it is and that's the previous little level of demand and as you can notice here some weeks have appeared on this market showing that at least there's some whale buyer here trying to show some reprieve big level for bitcoin moving forward is 23 000 still like we we cautioned and talked about the other day and we've got some other levels around 21 as well so bitcoins starting to form a base but it's not quite there just yet let's talk about some other broad markets so we'll just talk about the ftse here quickly ftse coming down obviously looking towards breaching out why can't it do so it's waiting for the u.s i mean a lot of these markets are waiting to see what wall street wants to do after it's massive short sale that they like to you know make sure they make a lot of money on in the previous week being the quadruple witching so that big short sale came through during quadruple witching what a surprise hey so here we've got the ftse it's sitting on a critical point ahead of the us open we've got the asx 200 sitting on a critical point i think all of you could see this ahead of the us open we've got iwm which is the russell 2000 what's it doing kind of just floating around in this little area down here and it doesn't have too much direction on it yet we do have a critical point moving forward 175 174 and a half that will be big but of course before then i expect something like the s p 500 to give us some decent signals let's move over to the nasdaq so the nasdaq is recovering relatively well here in the futures market there's going to be a gap at least all things considered between where the market closed on the friday and where the market's going to open on the tuesday that allows shorters to come in and potentially grab liquidity there's going to be some buying you would think around that 11 2 that's going to be a level that some people might fight it out for and some day traders might be looking at that level but the biggest critical level moving forward on the higher time frames is going to be around this 11 8 area that's still quite far away percentage wise but think about it if we do this we change trends on so many time frames two hour three hour four hour even the daily everything changes towards the up and i think that's going to be a big signal for a lot of people out there that the squeeze is occurring in terms of the covering and that covering is going to go hopefully to fill some of the gaps we'll move over to the s p 500 just to understand where the gaps really are in these markets we'll go down to the one hour and you'll see from the real market action it didn't really look like it was turning just yet we do have one gap two gaps three gaps aggressive selling second biggest in history recorded makes sense why we have so many gaps now yeah and all of these could be of course filled through some kind of short squeeze now if the market is going to go down and pressure further lows what becomes the logical area that it should go to just so everyone is aware the general area that most people are thinking at this stage is somewhere around this 200 sma and that sets us around the previous highs that were caused in september and november of 2020 and of course the 3500 level as well so this will be a big one if shorters get a new low in throughout this week you could expect further selling down to this level a lot of people are starting to cause that and most people's reasoning why that could even happen is because they believe on the vix that we haven't seen capitulation fear if you go through the vics throughout history most of the lows have been put in place with incredible fear zones now that doesn't mean that this fear spike was the low but that shows that real fear or capitulation trade coming through this time around we've hit 35 a lot this year which has been the low so it's been more orderly in terms of pure fear coming through the markets some people believe that we're going to get one more spike that's going to form like a 40 or a 50 plus fix and that will hit and coincide with that that level on the markets and of course the s p 500 will end up being at around 3 500 at that point the bear case is strong but i think we need to see the low print before that occurs let's talk about the futures market and of course i didn't want to bring this chart up without talking about the rest because it looks crazy when you first see it look at that it's a green fest and the reason why it's there is because of fibs but let's talk about this box here probably the most important area we know where the lows are this is of course the futures market so it's been trading outside of the u.s market and we know where we had that previous supply problem which is here so at this stage the market's going to open up above this level technically be first time frame changing trend which is you know you would think yeah okay if that happened that's a positive but it hasn't fought off the previous supports previous demand area becoming of course this big resistance zone as well or supply area you breach that pull back in the markets probably most likely to grab liquidity maybe even fill the gap and then hopefully a movement forward the other solution is shorter has come in around this session today and they try to session sell it if that occurs fill the gap maybe some buyers try to commit there but if the market keeps falling and it gets underneath this area i just don't see a level other than 3500 at this point that the 200 becomes a very strong magnet for the short sellers so super interesting week we've got a lot of dynamics here we've got big levels around this 37 30.
obviously practice risk management guys these are just ta levels and just my opinion they're not for you to go and do anything with unless you unless you've got your own plan and as you notice this would be a significant change at least on the first time frame and could put in place for us to start filling some of these gaps that we've left behind really far off now the other thing is think about that nasdaq this would be the higher time frame change of trend and if that occurred then you're talking about those really big gaps that were left during the aggressive short selling so some big stuff here first steps baby steps first get through this level fill up to that 3780 in terms of where the previous gap was i think i've got it yep i've got it measured here so that's that previous gap then we have the resistance and then we have the rest so there is a chance that this market might rally this week and hopefully it does to start to give some reprieve to what's been an aggressive short off but if it keeps going 3500 if we go through some of the expiries in the recent in the subsequent weeks what i notice a lot of is a huge amount of puts sitting around these 3 500 34 5 kind of level so these two levels seem to be really critical here and even going into the expirations this week and if we're talking about obviously the 24th you'll notice that the max pane still at 384 not that that of course is giving us that many signals but still very strong put levels all sitting around 45 strange i think we'll remember 345 350 we'll put a huge level on that in the future and if that's going to be where the market ends up defending well that is going to be where it is calendar for the week ahead if you didn't watch our other videos it's important to know that there is a bunch of information coming out obviously fed chair pal coming out to annoy us all on wednesday june 22nd is coming out 9 30 a.m new york time that'll be so much fun we always love it when powell comes out papa pal and then 10 a.m on june 23rd and then we go on to the weekend so there's a little bit of information coming out here for the us obviously papa powell and his effects on the markets statistically of being negative then positive in terms of when he opens his mouth and then the reality afterwards but do be careful in these markets these are going to be ones that can move like this and just because we saw some of the biggest short selling in the history of knowing the recorded levels it doesn't mean that it is going to squeeze and cover up but of course that is a case to be made on the markets he video we'll see in the next one bye for now



Comments 0