
저자: FXEvolution채널진행자 · 외국인
요약 보기
2022년 7월 시장이 최근 5주간 극심한 변동성과 공포(풋옵션 급증)를 보였다고 진단하며, S&P500이 방어구간에 있고 달러지수 약세·국채수익률 하락 등 신호가 혼재한다고 설명. 반등은 bull trap일 가능성이 크고 3500 부근까지 하락 가능성을 언급하나, 3840 돌파 시 상승 추세 전환 여지도 남김. 유가는 105달러로 약세, 금은 불확실, 반도체 약세·경기방어주 강세로 위험회피 신호.
다듬은 글
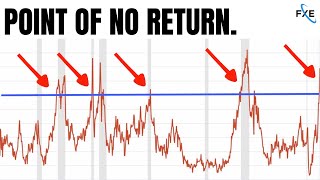
hello everybody and welcome back to another video in today's video we take a look at the stock commodity and crypto markets right now and potentially focusing on one of the most important levels that we've seen in some time the s p 500 is now at what we call the defended zone online the thing is the market is actually looking incredibly sick whether we look at sector rotation and the movement under the hood of the bigger players whether we look at the money flow and the huge amounts of shorts that are opened by the street right now in these markets or of course we look to the bonds market that's telling us that things are potentially looking down there's really not much to like about this market right now and maybe the eventuality is towards the 3500 zone there is a level though that gives us some hope and that is if we breach past right around here so stay tuned as we break down the markets in the next couple of sessions and talk about the key levels that we need to be watching so much to discuss see you very here let's get started by talking about some macro data then we'll get into the sessions and what's been happening in the flow and of course we'll talk about the charts and everything to do with options as well let's begin by discussing the last five weeks well it was one of the most volatile five-week periods ever we already know that we've seen it in the charts but it's starting to be another one of those highly statistical events which shows us that we're in an incredibly fearful market with fear what comes well of course a huge amount of puts and the current level right now we have a large amount of puts being opened in the current market condition now you'll notice this was taken the previous week so of course what happened after that point we rallied a bit a lot of these puts have now expired and many of them worthless there's still a lot out there though so we've got a lot of puts and we have also a lot of negativity on the street it's kind of now or never for this market to really recover before going to the next big low which many people including us have been talking about here on the channel for a little while so bouncers are they real are they not well unfortunately whenever we have a rapid bounce like we've seen recently they do tend to be short-lived this has led to many bull traps throughout the 2022 period july sometimes offers respite and it's been an argument that we've made here for a few sessions now where we've talked about do we see the recovery train of july so that we can get a little bit of chop before probably the eventual drop later on in the next couple of quarters that's to be determined and at this stage nothing seems to be following the standard data points that closely for 2022 so far us equities have been d rated at the fastest pace on record no surprises here obviously d rating is a common kind of concept here on the street the only problem is earnings estimates are always wrong during these times as well so even if they're derating at the fastest point often the earnings results and the estimates are generally wrong to the real reality of the situation so don't trust so much the d rating or the earnings estimates or any of these things instead focus on the price action in the charts and also some of the hard data points of what are actually going on under the hood make sure you subscribe to the channel as well because we will be having a look at a very important report that's going to come out this week that i think is going to show us really what's going on here in terms of the bigger traders and whether they've continued to place huge shorts over the last week or whether they're starting to reduce their short positions it's going to be paramount to the success of trading so i'd like to just give a massive shout out to the discord community here because whether it was our private stream from the last session or whether it was also the public discord community link in the description down below for both of those things we had a pretty good session while everybody else was probably a little bit upset with what happened the gap opened on the way down and there were so many reasons we liked the ability for the market to pick up around that level of the 50 or the 40 zone we'll take a look at that later but basically we got the movement up it ended up going flat and of course then sold off throughout the day to do the pullback now it's not the sell-off that's the worrying component but there certainly was some good trades to be had in this session here with the movement towards the gap fill and i think a lot of people in the community are pretty happy about that and congrats to everybody always join if you're interested in seeing more about those types of things let's now talk about what actually happened though in the sector rotation well some interesting signs here metals energy gold all got dumped what got purchased utilities little bit of solar solar continues to do quite strongly here and we also saw xlp xlv the defensive sectors coming out and being purchased through the session now this has started a trend that we've seen here in recent days look at the top performing sector utilities look at one of the other top performing sectors staples what's that telling us the market's gone defensive again just like a few weeks ago where we really thought around the idea that technology was seeing an increase move and it certainly did that was the best rally we also cautioned this week against that being the continuous move these have been incredibly fast switches in the market where they're going from saying oh yeah we love the technology side too oh no we don't and it's it's very important you understand which market you're in because if you're in the wrong one then you can get really beaten up by being in the worst asset at that time let's talk about the vix the volatility index here look it's in the middle of nowhere 28.69 elevated very highly a lot of people that don't know what the vix is it's the fear index as many people call it and it's important to look at but it's not giving us too much extra information what is giving us a lot of information though is the us dollar index that is the dixie here i just put it against the s p 500 so you can see it notice the kind of changes of trend when the dollar index has been going down or sideways the market has been rallying when the dollar index has been weakening again here the market has been rallying weakening rallying and now we're rallying weakening so what this is is it's a really good ramification or just justification i guess of showing the money coming out of the system and into the system depending on whether big funds are purchasing or selling the stock market overall net they're starting to turn the most bearish i've ever seen huge amounts of shorting going on in the market and then not closing those shots at a very fast pace throughout this rally i've spoken about that this week which is why i said it could be a bull trap and we've talked about that concept a few times this is the important factor though what if the us dollar drops in the next couple of sessions well that would be a lot of welcome respite because if the us dollar drops we've seen a strong correlation with the s p 500 that's almost been kind of in lockstep or very close together something that i would be watching on the charts another good bit of news in some ways though it really just means that the economy is kind of sick has been the us 10 year and two year yields decreasing a new low formed fantastic that means that you wouldn't think in essence that the market could potentially rally but at the same time what is this is this some kind of sickness in the economy or is this just yields and of course inflation decreasing some of the stats we've had coming out recently have shown that the inflation could be kind of dropping marginally but still at incredible elevated levels some good news for bull traders and that's why we're getting to this critical point for the next 24 hours is that the dollar index on the one hour time frame changed its first time frame change of trend so while we do expect a rally here somewhere around 105.20 or even where it is at the time of this recording could be areas where the us dollar will actually drop if they do drop that could be a good signal or at least a good coinciding signal with the u.s stock market being purchased back up because it really is now or never for these markets let's move over now to the u.s oil market here and we'll talk about oil we've been correct on this one oil did drop change of trend of course occurred what happened oil dropped off a cliff opec also agreed to slightly marginally i think rise or raise the amount of barrels coming out that's good i guess for the the economy in general of course it may lower or go to lower some of the costs of everyday life but it's still not a very positive chart in terms of the way that oil is trading at 105 a barrel never a good thing in the economy it looks like more expected weakness would be here for u.s oil if you take a look at the daily now that's two big red candles basically you'd be looking for a new low and then a potential test of anywhere from 98 all the way down to about 94.
demand destruction in play in some ways here on these charts and it's worthwhile watching gold not so good yeah it actually did something pretty interesting so we saw the bit of news that came out and gold actually went to rally heavily probably picking up a bunch of supply at that point and i think the streets started dumping gold into whatever example they had now i have talked about the bullishness of gold here we are entering into one of the better months of the year for gold which is july i do like to focus on those things and obviously i will still be looking at gold on the channel but at the moment it's at a point where you wouldn't really want to make too many decisions on it it's kind of at the demand level it's underneath there's a chance it goes all the way back down to 1789 there's also a chance it randomly just bounces up you can see the trend line here of the last couple of peaks and how it's acted so we're going to have to look for more information on gold the manipulation is fierce on this metal and i don't see enough people entering in long that is the bigger players to really say that the july rally is coming for it just yet let's talk about some key indications that are looking bad for the us market one of those is semiconductors versus the s p 500 another good way of kind of looking at the risk on risk off nature of the markets at the moment very much the risk off nature and the market has basically almost made a new low here on semiconductors showing the weakness in the technology sector particularly one of the biggest higher flyers i mean this has been for a long time one of the best performing sectors in the market but it had so much maybe too much bullish gain on it it's going to potentially give up a lot i'm really not bullish on the semiconductors at the moment i know a lot of people are but i'm super not and this chart can show you why xly xlp another poor performance for this this helps us gain again risk on risk off but more from a rotational basis standpoint we were feeling okay about risk obviously we talked about risk coming on we liked risk still here and then all of a sudden we started to see other signals that were telling us that maybe it was a risk-off environment we're still at the low but it doesn't look too healthy let's move over to bonds down there is this lqd it's corporate bonds to explain this really you need to understand how bonds really work the best but i will say this about bond markets it's understanding that there are two components that go into bonds interest rates and risk right now interest rates are very high of course that's a huge component when we think about it of where the market's at but when you think about where the market was at during 2020 a lot of people look at this and they'll say oh look it's the same price yeah but we're also talking about a risk component over here was interest where interest rates very low yes they were therefore this was almost all risk in the markets over here was interest rates very low the answer no interest rates are much higher so while the interest rates are dropping is the bond market really putting on that much the answer no this is not good and while bonds do look like they're at a critical kind of level realistically we just went through a new low on some of the indications i use not a positive sign for the medium term here for the markets and i'll continue to keep you updated on that but i don't like it when bonds and u.s stocks are not agreeing with each other and when the bonds are going bad i usually pay attention tesla here yeah it's just kind of hovering around the zone look it did a good job to hold itself obviously i think tesla is like a proxy to risk on in some ways here if you trade let's say the spy pickup and the s p 500 is rallying and then you have a tesla position which you want to enter because it's rallying through this point the s p 500 is giving you the green light well then this is not too bad and maybe it'll work out i think breaking past 690 is going to be a big deal if it can do so on the friday if it does then the next stop for it could be as high as like a 7 30.
so tesla's more of that kind of proxy but for now we know 620 is demand and if the s p 500 starts to fall i think tesla will just fall in line with that and then we'll find out whether we can hold the base at this stage i'm not too sure if that's going to occur let's look at some of the other reasons why this looks pretty bad we talked about the dax this is the german 40 market and a lot of other markets around the world are showing a lot of weakness here we had the rejection candle the double tweezer not a good signal and then of course it went bang one day two days three days we're in this support at the time of recording and we're going to be there coming into the friday session you can see what's at stake it's kind of now or never we get through this zone what's going to happen where's the next drop-off point well unfortunately on something like the dax it could be as low as 11 600.
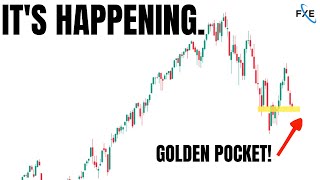
that's not going to be pretty for anyone that's out there and i'm sure many bears are like licking their chops thinking about the fresh salmon that they'll be getting when it gets down to this level because yeah it's pretty low there nasdaq held its own as best it could created a bunch of dojis at the last 15 minute kind of trades of the day it filled the gap on the way that it created down so it had that gap down balled up filled the gap so that's basically efficient in this case for the market to recover you've got to get through this zone here this is it right there is the recovery area and let's move over to the s p 500 so we can see it in a better form this is the doji that was left on the daily but i'm going to use the futures market just to explain this level here so here's at the time of recording the level we had chalked up yesterday 37 40 37 50.
you'll notice we're back there now that was a very good level for a turnaround it did turn around and it bounced up to the 3820. now the problem is where is the supply so if you're a person that looks at supply and demand kind of dynamics we broke the first level which is here we've pulled back now down into here it has to kind of start to go right now it really needs to start putting in some legs but to change on the higher time frames you must breach this distribution area because of course this area here ended up being the short zone so we really need it to rally and until it gets i know sadly enough above 3840 it's not changing the trend on the one hour the two hour those types of time frames towards the upside at the moment you've only got like five minute 15 minute those types of charts with you so it's kind of got to move up and if it doesn't what's the next stop for this market well i think the problem is it's going to be pretty low if you put on a weekly s p 500 and we'll just do that together here we change this to a 200 make sure it's set 200 there simple we go to a weekly where is the weekly it sits here at 35 10 previous resistance highs back from september october and november in these markets if we then zoom it out look how the market loves its weekly 200 it's liked it a lot in the past and this is a key level that i believe a lot of buyers at least wall street buyers may change their commitment in these markets possibly we reach that zone let me know right now because that's going to be a very important area the other reason we thought the market could potentially go up in the previous session that you can always apply and remember ta number one options and this type of concept well into the number twos would be the maximum pain now you'll see 386 maximum pain well that didn't happen but that was much higher than the current market price at the open remember we were in that 370 ranges also this the random amount of puts that was sitting at 380 for the options expiration on the 30th of june now this was a fairly big deal the market goes goes up to this level and i don't have the updated data but i assume a few of these were closed and at the same time it actually ended up hitting the perfect max payne i believe for the qqq coming into friday what have we got well no real clear zones we've kind of got this middling area which would all be fantastic for the street to close at maximum pain is technically 383 much higher maybe if the bull rally starts to happen that might make you feel better but at this stage it's all about this kind of like 370 put and all about this 390.
do i use these no i don't use them predominantly i just use them as a little bit of goal posts should i see the correct technical setups and then think okay maybe that then the rally could go into these levels that's the type of thing you're thinking about so stay safe out there on this type of stuff it's it's super important to do so for bitcoin well it's doing its own thing another liquidation event over the previous 24 hours it's still in a massive setup i believe between key supply and key demand i don't really like touching it at the moment it's not that predictable and i think we come back to this as we go through it and of course we'll always be focusing on bitcoin but no updates there in the last 24 hours for the news ahead there is one big bit of news ism manufacturing pmi expect that to be the pivotal kind of bit of news 10 a.m new york time that's going to push the market whether it goes to a new low or whether it looks fantastic and suddenly the market goes hey i like this bit of news at the moment the bigger signals are pointing towards the down the trend is looking pretty nasty in terms of that weekly daily trend and it's really down to the small time frames making a huge shift here and once we get above that 38 kind of 40 area on the spy it looks like the rally will continue probably past that previous peak and get into our big trend line thanks so much for watching if you enjoyed today's content remember to subscribe smash that like button guys and we'll see you in the discord communities and of course on twitter fx evolution is our handle bye for now



Comments 0