
원문 보기
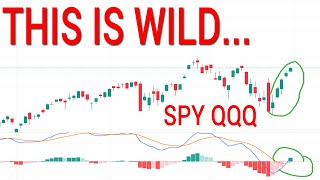
Well, it seems that we need to talk about some things cuz we have a move taking us outside of the weekly expected move, even taking you outside of the daily expected move and is a crash on the table. Well, we have seen a good confirmation with the price action and all your moving averages. You have seen a good confirmation with the MACD and you have seen a good confirmation with the RSI.
And this is what we put out there and said, hey, let's be careful if we do see this, but understand that this area could form some kind of trap. And what other thing would be pointing towards a trap that you may want to watch? till the end of the video. Volatility you would expect to be popping off a little bit with a sell-off like we saw right in here, but it seems volatility does have some indecision and some interesting signals to go over.
So, make sure you stick with us throughout this entire video. We're going to talk about the daily chart for a moment here. Then, we're going to get into those shorter time frames to get you updated daily expected moves. Let's get into it. So, first of all, I feel like it's important to talk about the daily chart.
And when you do see these days like this, right, we have seen somewhat of a confirmation. I just want to remind you that these times where we do see these confirmations, notice that we confirm down. We confirm the first divergence point, but remember that it's important to watch what's going on in this area.
In this area, we can go over it maybe this weekend, but we did have a 2hour divergence right here to see that 2-hour big bounce that rolls, right? We've talked about a bounce that rolls. This was a good scenario for that. Then we talked about the two-hour divergence here, right? Everyone thinking we're crashing on this bar, this bar, this bar, this bar.
Everyone's saying crash on those bars. Even this bar right here, people were just recently saying crash. And we were saying what? Look for that upside move. Now we're saying what? Well, we're still seeing that we haven't seen the hint that says this is going to roll. So yes, a crash signal here has confirmed.
You have divergence all across this MACD. It is really close to the center line. If you took the full technical analysis course, now you know how we really treat the MACD in this area. And then you also see that the RSI confirms. So what did I say in my last video? It's going to look really bad. It's going to look like we are crashing down is going to be a good confirmation for that crash signal being a closing bar beneath the moving averages.
We have that a closure with this cross down really close to the center line. We have that and it's confirmed the divergence in the near price action and all the way across. We have held it the entire time. It's not a good look. And then we also see what we held the divergence here on the RSI and the near price action and extended across.
Is this a risky risky crash signal? Yes, it is. But what I was overall suggesting was watch that 2hour for the hint if this is going to really rotate down. I'm not saying this isn't a good confirmation for a crash. I'm saying let's do exactly what we did here. Let's do exactly what we did here. Let's do exactly what we did right here.
Let's do exactly what we did here. And still pay attention to the bullish case because this market most the time goes up. This means I am paying attention if I took some kind of crash bet. I am paying attention to what? If that would go wrong. What would that be going wrong with the daily signal according to the full technical analysis course where I teach you how to actively manage trades using confirmations.
If I was in a bearish trade right now and the 2-hour chart was able to curl up, where is the 2-hour? I am overall just helping people out a lot in case something goes against you, right? We talk about this in the course. We actually call it how to not get screwed. The 2-hour is still by that center line.
So, even though the daily has crossed down, if you randomly see the 2-hour cross up, that would be a good time to manage that trade. That is just how I like to do things. That's what I do with my trades. I like to actively manage trades. Sometimes use stops. I just want to put that out there. Now, why would I be risky of that?
Well, because it could be a false flag. This could be a false confirmation. We have one extended move up. We have made the new high. We could be building the structure we've talked about for a while in here in order to get down by that center line for the 2-hour pullback to curl up into positive territory.
We were prepared for this over the weekend. We were prepared to come down to what? Even a little bit lower. We were prepared to come all the way down to that 680 level. Just a little bit lower. So, that's what I really wanted to put out in the beginning of this video. I really wanted to put out there that you do have a crash signal that has confirmed on the daily chart, but you most likely will need to see the 2hour prove that with some kind of role, you most likely will need the 2-hour to cause one more trap that causes the role.
If you think the crash narrative is there, the other thing that we're going to get into at the end of this video is volatility. Volatility has some very strange behavior. If you think this is a crash, u you see little to no movement from volatility. This was a pretty dramatic down day after reaching a high.
Most of the time you would see things as very very bearish and a lot of the you know Twitter community X communities or whatever they would start saying very very bearish things. Um I'm not seeing volatility pop off though is what I'm overall getting at. So we'll get into that towards the end of this video.
Let's get into what could happen as far as where we're at right now and the percentages going on. As of right now, you are outside of your weekly expected move. That means what? On Friday, you have a 68% chance just to do that by the end of the day on Friday. I wanted to point that out to you. That doesn't mean that this has to be over.
This means we could go into another 30-inut roll. And so, we're going to talk about the 30-inut chart as we look into um the daily expected moves. So, as of right now, we're dipping down, right? good buyers dipping down in this area. So, if we're going to keep heading down, then we're going to see the two the 30 minute keep rolling or create divergences and things like that and they're going to fail.
But, if we're going to create what we were actually pointing towards, what we are leaning towards, if we came down into these areas, you might have heard me say in my last video, even if we come all the way down to 680 to 682 and we create some kind of divergence, that would be a good sign that we are going to turn around.
So, what am I looking for in this area? If we are getting a false flag from the daily chart, if the 2-hour is still going to curl up in positive territory in the next couple of trading sessions and we're going to see this high tested and possibly even go make a new one, I would need to see the hints from the 30 minute.
The 30-inut chart coming down nice and negative as of right now. What are we looking for from the 30-inut in this area? We will be looking for a higher low, right? We come up to that daily move, then we come down and then we curl back up. Right? That would cause us to get up by this center line and curl into positive territory or we are looking for some kind of divergence.
Right? The divergence that we would be looking for is a reaction to potentially these type of areas and we see another drop down to potentially fill this gap around that 680 and then we curl to the upside. That means we could see a little bit more selling. That means we would see one more roll down but create some kind of divergence point that then gets you closer to going positive and hopefully we are able to see that on the RSI at the same time.
So I would be paying attention to both of these scenarios. Do you know how we continue to be bearish? Well, a lot of people would play this role actually right here. So a lot of people right now would say I'm going to take my profit. And me being me, I like to take profit if we go pretty far outside of the weekly expected move if I was bearish and I would take profit at that point.
I wasn't shorting this move just so we are clear. I think this is a pullback. But if I was going to short this, I would still be waiting for that 68% chance bounce. And then I would look for the roll as we retest that 5day. And if we curl to the downside, you would say, "Hey, if this comes down to here and doesn't create the divergence, then you're falling through down to lower levels and most likely going to a different daily expected move.
But if you create the divergence point, that's the important part. If you create the divergence point, that is when you want to be trading like water. you see a confirmation. I do not want to be bearish if I see a bullish uh contrarian signal to the upside that suggests that the two hour is going to curl up.
And if the 2-hour curls up, what happens? The daily might be a false flag. So, I wanted to walk through all of this pretty diligently today. And it overall goes like this. How I overall am seeing it is if scenario one of a higher low pops up, then I don't want to be bearish. If scenario number two of a roll that looks like this at all and I want to be bearish, I need to be able to switch if I create a divergence point or higher low.
So, scenario number two would be a divergence point and scenario number three would still be the uh little bit less probable one in my book and that would be that we are going to see this drop even further. Then we are going to see the 2-hour roll up and then we are going to see it plummet. So, scenario one and two are what I'm really watching for.
If scenario three pops up, then all I have to do is sit back and not buy anything and wait for that two-hour roll right over here. And I think I didn't even read off those daily expected moves. So, I'll do that before I get into the cues here. 68686 to the upside for the spy. Uh 67698 to the downside for the SPY.
I actually wanted to make a point about this. So, I'm going to switch over to the Q's uh and do it there after reading those off. I'm going to make sure to read those off for you. Q's outside of its weekly. So daily expect moves for tomorrow 61931 to the upside 60931 to the downside. This range might look massive to you.
It's not. And this is what I think is fishy about this overall move. This is not causing volatility to go up. You are not seeing implied volatility to go up right now, which is very interesting. A lot of the time when you see that random selloff that people are looking for and you start to see confirmations, you start to see uh people get very excited about a crash, we every single time we have seen implied volatility increase dramatically.
We do not see that at this point. And usually when we do see that drop dramatically, you'll get some kind of little bounce like this in the morning and you just tank down if it's really that bearish. We did not see I want to be very clear implied volatility did increase but just a couple of weeks ago we were going through this or when when was this?
This was yeah a couple weeks ago we were going through all of this. When this was going on I saw percentages like the Q's have a daily implied volatility of 23% of 21%. The spy has 19%. The Q's right now have about a 15% implied volatility going into Friday. That's not that big. The SPY, I believe, has like an 11 and a half or 12% uh for their daily expected news for Friday.
So, if there is a crash here, people aren't prepared for it. Again, I'm just saying that people are not um really putting that volatility out there. We're not seeing big bets in both directions, and we're I don't think we're seeing too many big bets to the downside just yet. I think if you could see one more roll, you might see those honestly.
But I just wanted to point that out. That is something fishy. And we're going to go over volatility in a moment. You are outside of your weekly expected move. So we don't need to go into those other time frames for a moment here. Let's focus on the 30 minute. The 30 minute is the most important one.
If the 30 minute, you can see this MACD. It's way down there, right? So if you want to turn around, what's got to happen? Well, a lot of the time you're going to need somewhat of a divergence, right? We see we see points where we're not even making divergences. Maybe they're on the RSI but not the MACD at the same time and we get a big bounce, right?
It's kind of hard to see on the screen, but I just want to stick with the price action for now. But you see this RSI divergence. We don't see that right now. So, we might have to create that, which means we can spend a couple of days down here, right? Which is perfectly fine. So, we could see that reaction up.
We could see that roll. And if this rolls and we don't see that turn around, no divergences there. you just hold on to that sucker because it's going to go down to lower levels potentially even down to the lower expected move last next week which we'll give you on Sunday. But for this right here we see what if that would create the higher low then we're back to the races.
Why the 2-hour is right at the center line. The 2hour is right at the center line. So on the 30 minute we're looking for the hints of a higher low right something like this or even a burst through to take back that five. That would be insane. And the reason that's possible, we're going to go over volatility in a moment.
Uh, but you also want to be prepared for that to roll again. Maybe have a little management for the trade. See if that comes down to these levels. Maybe even someone takes a role play here. Someone takes a bearish trade. That makes total sense here, goes down to that lower level. But if you have that bearish trade and this confirms a divergence right here, be very, very cautious because that is suggesting that the 2-hour can curl up.
And if the two is by that center line, that means it's positive and has a good shot to go test that high. go and make a new one. And if that's happening, then this daily signal here that confirmed uh just yesterday will be going wrong. So, what are we talking about? We're talking about a big time frame confirmation that could go wrong.
And that's all we're looking at in our weekly expected moves. Our 68% zones are suggesting we need to watch out for some kind of move to the upside uh going on into Friday. Now, I say that, but I don't want you to forget what confirmations we have right now. The confirmations we have right now are bearish.
We have not seen this thing turn back up. If we had seen some kind of signal that suggests that this was going to turn back up, then I would be in calls for 700, right? I'm not. So, if I'm not in calls for 700, then am I bullish? If I'm not risking money, am I really thinking that the market will go in a certain direction?
No. I'm sitting and waiting for my good trade setup. That's overall what I'm doing. being a little bit patient because I am seeing some fishy things from volatility. Volatility on the daily scale, right? This is horrible. You would expect the daily to be curling up into positive territory right here, would you not?
You would expect this to be able to curl up on this MACD. And you would not expect to see kind of an indecision bar, right? If we zoom in on this bar, uh pretty equal overall. It's kind of a little bit of just indecision. It doesn't look like we saw a big dramatic downday in the market where you see a big green bar that comes up and closes like that way up at these levels where you see that 10% uh you know upday for volatility.
We didn't see it, right? And that's surprising to me when the spy bar looks like this. Like that's surprising to me. So what you got to do is you got to look at that 2-hour chart. You got to go, okay, this is still by the center line. This is still a potential failure. And overall, we're seeing what it looks pretty darn flaggy to me.
It does not look dramatic yet. It can get dramatic. That's why I'm not necessarily in calls yet, right? These are bearish looks. The 2-hour is going into positive territory. I don't want to be in calls yet. The 30 minute just curled up again into positive territory. So, if I was in calls, I would be managing that and waiting for a reaction on Friday to see if I can find that opportunity.
Why would I be watching Friday morning? Well, because we did make these highs and now we have lows from the overall uh MACD. So, in the near price action, yeah, you showed the lower high, right? High, lower high again. Uh but it technically made a new one. So, we want to watch for what? We need to watch for a reversal signal.
The crazy thing is going into Friday, we're holding a reversal signal, but it is not confirmed. So, you do see divergence on your MACD for the 30-inut chart for volatility. You do see that on the RSI. I just think that is fishy due to the selling that we saw on Wednesday. We did not see look the last 30 minutes of the day.
I think you could go over here. The last 30 minutes of the day, we tapped up high. We tagged uh the low of the day. Volatility on the last 30 minutes of the day is right here. We went down. So, I'm not necessarily convinced that this is some kind of dramatic volatility moment yet. I can be convinced, but I'd most likely need to see some kind of two-hour roll or just more selling in tomorrow.
I know to look for that two-hour roll at this point. So, what are we looking for from volatility? Volatility, this is a reaction signal. This means you have a 30-minute divergence where if that were to confirm to the downside, you are close to that center line, meaning the 2-hour would rotate down. meaning that what if all these things were to take place, which is something I'm kind of leaning towards at this point, then the daily signal for the spy would fail.
This daily signal right here would fail. These are the exact same things we did right here. These are the exact same things we did here outside of a monthly expected move. Even though we cut out that low, we did it here. We did it right here. Looking for those divergences at key moments. You're outside of a weekly move going into Friday.
you can see continued selling, but we're going to do our job in the shorter time frames to make sure that this is selling off. Why? Because most of the time the market goes up. So, most of the time the market goes up, we want to be paying attention. Thank you guys so much for watching this video. I know you guys are going into 2026 with that whole new mindset.
And something I like to do um at the end of the year is I go back and I actually really look at some things that I could get a little bit better at. And this is just something that I like to do every single year. But I also go look at things that I did right. Right. I think it's important to to say, "Hey, I want to capitalize and make sure to um minimize actually my weaknesses." But at the same time, paying attention to what you did right and trying to just do more of that is a very, very good thing.
So, if you had some moments where maybe you were outside of weekly moves, maybe you had divergence, but you didn't necessarily trust it, that course is down there in the description. We like to leave it up in January for people who are hungry to learn, hungry for a great year in 2026. It can start with just that little $100 course that really convinces you to trust these weekly expected moves, to trust your daily moves, to trust your monthly moves, and then look for those skills around those areas.
So, exactly what we are doing right here is exactly what you'll learn more and more about in that course down in the description. And half of that game is trusting what you're seeing in front of you and being very patient. So, make sure to get that while it is only $100. It is 90% off. you want to go into 2026 with some good knowledge in there, some some potential to actually get better at these things to really understand these moving averages and things like that.
Man, that course is down there for just 100 bucks. So, I really really enjoy that you guys are thinking this channel is super helpful and I think that's awesome. I just hope to be even more helpful in 2026. So, I hope if you have some time to learn, you go give it a shot. All right, thank you guys so much for watching this video. Have a great great rest of your day and peace out.




Comments 0