저자: 미상 · 외국인
요약 보기
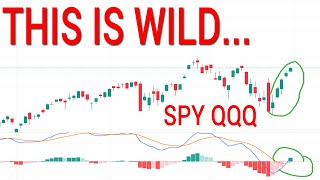
11월 월간 예상변동폭 하단 이탈 후 MACD 상향 전환, 12월 월간 예상변동폭 상·하단(약 707/660 부근)을 제시. 주간·일간 변동폭은 축소되어 단기 횡보 혹은 소폭 상승 후 2시간봉 눌림 가능성 언급. VIX 저점 낮아짐 등 하락 다이버전스 가능성은 주간 기준 연말~연초 경계로 제시하나 현재는 급락 신호 아님. 교육 강좌 홍보 포함.
다듬은 글
Welcome and thank you so much for clicking on my weekend video. And one thing's for sure here, guys. After looking at things down here, this is wild. Actually, it's it's actually not that wild to us because we were the ones that were pointing out, hey, maybe we shouldn't be dabbling with that crash kind of narrative when we do have reversal signals outside of a monthly expected move.
So, for today, since it was the end of the November contracts, we are going straight into December. That means I can calculate some December monthly expected moves. We're going to give those to you in this video completely for free. We do this every single month and we do this every single week. So, we will give you updated weekly expected moves.
And most the time we're posting every day where we give you those updated daily expected moves. And we're going to go through all of these in today's session and talk about the week ahead, but also talk about the month ahead as well. So, let's get into it. Now, first off, we remember where that monthly expected move for November was.
The first thing as we talk about these monthly expected news is see what happened in the last one. The last monthly expected moves were tagged to the downside. They are tagged 75% of the time. So you have a 75% chance to usually tag one of these yellow lines. That being said, we tagged the bottom side and this is why everyone was suggesting stock market crash and even though we broke critical levels, the market can be very very tricky and you don't necessarily want to be piling on those crash bets when you do have 2hour divergences and things like that.
Now, we've been over this a lot over the past few, I would say, weeks a week or so. If you want to see any kind of information about what we were doing down here, well, then you can click on any of the videos in the last like week. We've been pointing out these signals. You can even go back to the date of uh Thursday the 20th and see what we're saying back then.
Now, we do have updated monthly expected moves. We have 70719 to the upside above 700. Very, very nice. And to the downside, 65959. So, in uh just looking at these straight away, right, just taking a peek, taking a look at where they are, taking a look at where they are, you see that the MACD has crossed up.
How crazy is that, right? How wild is that? The MACD was able to cross up into positive territory. This is why we were heavily, heavily, heavily making people aware of the reversal signals down here of the break of this level and the little trend line here. So, we're seeing some good upside. If we take into consideration these two levels, we would say what if this wants to continue the overall I would say still trend of going to the upside, right?
Maybe the weekly trend at this point, but still the trend of going to the upside and we're not going to see some kind of crazy black swan roll here. Not leaning towards that. But if we're going to head to this upside, well, we're pointing right in that direction. We can beline for there. We can see a little retest moment and get there by December opex.
That actually would be the most probable thing with the confirmations that we have here on our screen. That would be the most probable thing from what we are overall seeing with the confirmations. So we have a confirmation in positive territory. We have an RSI that's very strong. We haven't seen a failure of this in any way.
So we would have to just say this is pointing in that upward direction. Now you can see where that 65959 is. So even if uh this wanted to flop down, the monthly expected move has risen up. That means that if you were to retest all of these lows, if we were to break through this level and create that big right shoulder for the inverse head and shoulder that no one's talking about, it still would be a heavy line of support around 660 around that monthly expected move.
So, even if you're able to dip down here, you would have to see something very crazy, uh something very unexpected in December to really really get some high high volatility in there. So, uh, just to clear it up though, if you didn't know, these are 68% zones. So, 68% of the time you'll land inside of them.
And I did put out a video a couple days ago discussing it. I love that someone checked my math and things like that. I said 32% of the time you will see something crazy. That is both sides. Technically, it is 16%, 16%, 68%, but that's okay. It's just the way that we're describing it. We go way more in depth with it in the course.
So, if you want to learn more about these ranges, more about the divergences, more about the trade setup and the reasons for a trade and the plan for if it goes wrong, you can go look in the link down in the description. We do have the full technical analysis course still up for our Black Friday, Black November sale.
If you want to get that, it is 90% off right now. So, all the things, if you've been sticking around for a while, you've been watching this channel, you've heard me talk about a bunch of different stuff. If you've ever not understood that or you wish to understand it further and you have some time this weekend, go check out that course in the description.
It will genuinely help you. It's only going to be a h 100red bucks this weekend and for the rest of December. So, check it out. And now, let's move on to some 2-hour charts. Let's get into these weekly expected moves and get you guys that info. The 2-hour chart is where we are going to zoom into the weekly expected moves.
Now, we might have to dabble into the 30 minute for a moment here, but we can see what according to the 2-hour chart, you're above everything, right? You're above every single thing you need to be above. Uh you're getting into those slightly overbought territory from the RSI. You can remain there for a bit of time.
But for now, we do see what to the upside. 69247 to the upside. 67431 to the downside. Uh something people will start to pay attention to are is the break of 685. People will seriously start to look for the break of 685, the reach down for liquidity and then head back to the upside. As for the 2-hour chart, it doesn't have to curl down.
If it does, you're at like a very low, very low, very low amount of risk to see some kind of mega drop even down to the monthly expected move. That's actually pretty that would be pretty unexpected for next week. But you have seen on a weekly basis these levels 69247, this level 67431. You're noticing it's not as big as normal.
The implied volatility for next week has really shrunk up and you have kind of dictated a trend. So, barring something crazy happening, uh, everything should be pretty dang expected. And that actually shows with the daily expected moves. You do see 68581, uh, and then you have 680 97. Look how tiny that is.
You went from days of of ranges like this and now you're seeing a range like this. So, nothing nothing's expected here is pretty much what's going on for Monday. That being said, if something unexpected did happen, that's where you start to see some crazy stuff, right? So, uh, these days can be a little bit freaky, but overall, you want to treat them like, hey, 68% chance to pretty much hold sideways, maybe go slightly up, maybe take out this level of 685, and then we're able to see some kind of pullback to grab those buyers to head up for an attempt at 700.
So, we'll be watching for that. Your MACD and your RSI, if this curls down, yeah, you want to be a little bit cautious, but not overly cautious. This is still very likely to make what a higher low as we did take out this level. So, you're very likely to make higher lows from the 2-hour chart. So, if the market proves to give you that opportunity and just to clarify that language real quick, that means the market doesn't have to pull back.
The market can just keep squeezing. People tried to short this the whole way up. I was watching it and I said it in my videos. I was like, they are shorting on the way up. It's like fuel to the fire. Uh I even tweeted about it and stuff like that. But if this 2-hour wants to, if the market needs to go grab liquidity and they give you that, understand that this dip down will most likely be a pullback.
Do not treat it as some kind of mega bearish thing. So, let's flip into the 30-inut chart to see, do we get any forms of weakness from the 30-inut chart? Well, we obviously see squeezing behavior here. We see that the price action is just heading up and up and up when we start to go to the upside. And we're not even crossing up on the MACD, but we're head pointing down now.
We're pointing down now. This means a pullback could happen at any time. This means shorting a move like this is going to be a very bad idea because if it wanted to, they could just dip it down for a second for liquidity, go down into these areas and find that liquidity and head back to the upside. But I think the daily expected moves here of 68581.
Uh it's very very critical to take out this level. Taking out this level tells you a lot. Now I'm taking out 685 uh this high right here of about 6. Yeah, just about 685. We'll say 68510. If you take out that level, you are like pointing all the probabilities to upside for the rest of December. Uh you take away a lot of the bearish anything that can really happen in December if you're able to take that out.
So something nice here for the bulls would be to take that out, see some kind of pull back down into these areas and then be able to curl back into positive territory maybe with a two-hour pullback this week. Now, these are all things that I discussed to draw up a potential opportunity. That opportunity doesn't have to be there and it might rhyme.
It might not be the same shape as what I'm looking at. We could squeeze all the way up, right? We could go up up up up to 692 and then see a dump down to retest into this little level right here and then we head to the upside. There's tons of things that can happen, but the big thing that I like to do right now is say, "Hey, a pullback seems pretty probable.
we are going to or at least the next big opportunity would be a 30 minute or 2hour pullback and I'm starting to lean more towards that 2-hour pullback at this point. So, let's go over to the cues for a little bit. Let's give you guys monthly expected moves, weekly expected moves, daily expected moves.
Go over it. We won't go as deep into it, but the Q's are pretty important. So, let's go look over there. You know me, I like to do things a little bit backwards for the Q's. Critical critical thing for the Q's are they took out this level, right? This is very big for the 30inut chart. So, let's get you guys daily expecting news.
We like to do it a little backwards. I just kind of test my brain. Keeps it fun for me honestly. And I hope that it's testing your brain as well to do these things. But daily expecting 62261 uh 61589. That means you know pretty much the market is expecting this like like nothing, right? Nothing really expected.
I think I think the spy had like a 6% implied volatility. Um now that being said, we do see that we're overall squeezing. So it'd be nice to get to this level. This level though would not take out pretty much what the Q's would want to take out. So they would want to see a little bit more strength. Maybe go to a second standard deviation up in here.
That's your 95% zone. Uh which is pretty much just two of these, right? So you just calculate that. I can give it to you over on Patreon if you guys really need it if we see us breaking through. But that would mean two second standard deviation. Then we start to actually pull down. And I do think that we would want to pull down into some pretty decent buyers.
I think pulling down into this area would be very very nice. Um I do think a dump down to really get some buyers would be the best. I think that would be awesome as it stands. But for the 30-inut chart, you're pretty much saying the same things as the spy. Some divergences in there. Pretty dry Monday as far as the market is pricing in.
We'll see what happens. A 30-minut pullback is still possible, but there is a chance for a 2hour pullback as we start to get to those overbought territories. Now we can see, you know, if we really wanted to create a few bits of structure in here, we can kind of see this. I think this would be very, very interesting as of right now.
But one thing we were drawing up was if we head to the downside a little bit more dramatically first, if we see some kind of December dump to really get people scared off, we still have this potential structure in here. So, I just wanted to remind you of that. But notice both scenarios are opportunities if the market proves to give you it.
Uh, the MACD has flung into positive territory, notice the difference. When it does not fling into positive territory and curls back down, ugly for a bit of time, but when it's able to get in that positive territory, it's way more likely to be a pullback. So, we would be looking for continued upside and a pullback down to about 607, uh, I would say down to that weekly expected move.
Or you're looking for kind of a rip down right away in December to potentially see a second standard deviation, a surprise down to these type of levels. I think that would be interesting. And then you head to the upside. I'm open to either one. I think they would be a lot of fun. But overall, the main thing you take away from this is, hey, the MACD flung into positive territory.
Do I want to be cautious about it? Probably. I probably don't want to mess around with it. Um, if this is curling down, but volatility is not telling me to be too scared of it as of right now. So, if this curls down, I might be a little cautious. But overall, the the people who play calls for like six months out and like to play a part of bull runs for a whole month, they would be looking for dips to continue to buy and buy and buy.
And the traders who overall like to trade, right? Overall trades shorter time frames, they would say, "Oh, there's my break to the upside. I'm looking for that dip so that I can join that upside because we are in positive territory for the Q." So, as we look at the daily chart, we're seeing what the daily chart is confirming to the upside.
So, even swing trade signals, right? The swing trade course is down there too, not just the full technical analysis course. It's very basic, very easy. Um, if you are very new to charts and things like that, the swing trade course is down there. Um, it's also 90% off. But the full technical analysis course is something that's just great to get with that because if you're going to advance your learning, if you really want to understand these moves and markets and how they move overall, how these prices are able to move, the VIX divergence, all those things, uh, it's good to get the uh, full technical analysis course.
That's going to do a lot more for you. But hey, swing trading, you can literally take that and make plenty with it if you just have some good rules. We see that we've confirmed up. We are not in positive territory. I'm still looking for the cues. If they want to jump up, right, if we just want to push push and then make that lower high, I'm watching for it.
Okay? I'm not going to say, "Oh, yeah, I'm ultra bullish for 2026 because of this move." No, I think we're going to set some kind of trap at the end of the year. Um, I think we've been building that trap for the last couple of months. We've seen some dramatic pieces of volatility that show you that it's coming, but it's not here yet.
And that was our big point down by the monthly expected move. So, let's give you guys updated ones because look, we could test that low. Look where that monthly expected move is. Downside 58717 to the downside. 65133 to the upside. Wow. So, we have some good good levels. We have some levels to pay attention if this is curling up.
It's not positive yet. So, that wouldn't tell us to really look up there. Right now, we just see it's close to the center line. So, we would say it's going to test in here or it's going to make a new one. Right now, you'd really be focusing on the test of the highs as you are overall negative. That being said, we can notice here that we're curling up in a positive territory.
Curling up into positive territory. These are all very good things. We just set a trap to the downside. So, I do believe it is more likely that we are going to see some kind of move to the upside than downside. As of right now, these things can change. That's why you subscribe in case things do change.
But as of right now, we looked at the 2-hour chart. We looked at the 30-inut chart. There is no sense of weakness as of right now for the Q's. If anything, it would be just saying if you see a moment of weakness, it is most likely a what? A pullback. A pullback in some way. So, keep that in mind. And now we go over the VIX.
And this is something I pointed out on the daily chart for the VIX was lower high, even a divergence point potential here. So, this is not good. This is not good for the VIX. This is suggesting that we're going to see what and this is actually something very big. I'm glad you're watching to the end of the video.
If you're watching to the end of the video, thank you, thank you, thank you. You've probably liked the video. You probably want I want to show you something because all the people that only watch the beginning and watch the spy part, they don't pay attention to volatility and volatility can tell you a lot just by looking at the shape of it.
If we look at the weekly chart, we look at where it is rejecting. As of right now, we are rejecting um after seeing a push to try to close above the and we did close above the 200 for the weekly chart. But look at the MACD. The MACD is right by that center line. So, what do I think is going to happen here?
What do I think is very probable? I think a a crash can happen going straight into 2026, but I think this might be bait. So, I am seeing what I am seeing that if volatility would curl down here and set up a weekly divergence, I think that would be very, very cool just for the MACD. It most likely won't be on the RSI, but it will be on the MACD.
And you notice there are times it is better to have them at the same time, by the way. But down here we did have that divergence on the MACD and RSI at the same time. So we would like them to be at the same time. We can pay attention if they are. But if you see any form of divergence on the weekly scale confirm uh towards the end of the year or towards the beginning of next year, be very very cautious with volatility.
But as of right now, let's go into what we're talking about for next week. As of right now, the daily scale is right by that center line. So this is where you want to say, okay, this is going to be an area where I really have to pay attention. If the daily scale goes like this, that can be a problem.
But then we look at our hints. We look at the two-hour chart. Is the two-hour chart here suggest just look at it yourself, right? You've taken the full technical analysis course. You know how to analyze things a bit. Look at the RSI. Look at the MACD and really tell me, oh yeah, there there is a there's a big hint that massive volatility is going to come in.
You just don't have that. You don't have that big hint. The only thing that you could say here is you do have potential for 30 minute divergence forming. You do have 30 minute divergence on your MACD. You do have 30 minute divergence on your RSI. I'm sure it's showing on the um I'm sure it's showing on the hourly chart as well, but it's pretty significant here.
So, we should be looking at maybe a potential dump early on in December. Some kind of pullback in December that fails would be the most likely thing. So, that's what I'd overall be looking for. I'd be looking for opportunities. Uh but understanding that volatility is not suggesting a crash is on the table.
In order to see a crash with this, you will have to see a 1% moment. No momentum is telling you it's happening. Anyone who's telling you the momentum is is dying here, they're not paying attention to the shorter time frames. The spy, a lot of people will talk about this weekly chart. There were so many times where the weekly chart goes down.
And this happens all the time with weekly chart. We're setting up those divergences. This is why we mentioned it because look at this. The weekly chart goes down to the 20 and it buys back up to set that divergence point. The weekly chart goes down to the 20, goes back up to set another divergence point.
Oh, down to the nine, down to the 20. You go down to the 20 all the time. This is setting up a potential first divergence point. So, we're going to watch out. As of right now, it looks like what do we need to be watching for? Some kind of two-hour pullback, some kind of 30 minute pullback to jump in on things because the momentum in the shorter time frames is perfectly fine.
The daily momentum is even fixing itself as of right now. So, this is not a time to be ultra bearish. It is a time to be looking for a potential pullback and treating it just like that. And we'll monitor things and keep putting out these videos to be as helpful as possible. Thank you guys so much for watching today.
Really do appreciate it. I hope you guys do check out that course that's in the description. Seriously, if you are watching this far into the video, you have that mindset for it. You want to get better. I can feel it. I can feel it even just making the video. I know where you're at. I was in your shoes.
And what I do is I pile everything together. I put together the things that help me that genuinely actually helped me get better, helped me in my trading, and I put those things into a course. There's not going to be a bunch of extra info to make me look smart or anything like that. That's not what it's about.
That course is blatantly there to help you. And that's why it's on a massive sale. It is 90% off. So, get it this weekend for only $100. And if you want to throw swing trading in there, if you're really new and you want to just dip your toes in first, get both, man. get the $50 uh swing trading course because that'll at least get you your mind thinking about, you know, charts and things like that and then you can go into the full technical analysis course and be like, "Okay, wow, I'm getting pretty good at this stuff." Hey, day.
Hope you guys had a great Thanksgiving and let's go get December uh with some vigor. All right, let's go into it with a good attitude and let's start trading the hell out of it for December. All right, peace out.


Comments 0