
저자: 미상 · 외국인
요약 보기
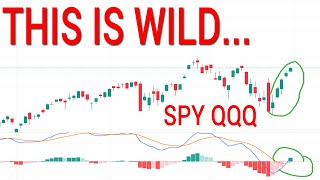
금요일 옵션만기(OPEX) 전후 SPY·QQQ 단기 신호를 분석. 2시간봉 하락 확인과 VIX 22% 급등에 따른 단기 반등 가능성을 언급하나, 최종적으로 하방 리스크를 더 크게 봄. 일간 기대변동폭은 SPY 상단 667, 하단 653 수준. 과도한 노출을 피하고 변동성 롱 포지션을 유지하겠다는 리스크 관리 입장.
다듬은 글
Well guys, I feel like we need to at least make some kind of update going into tomorrow because we do have those daily expected moves. And we did see some interesting things on the very short time frames that we are going to go over in today's video as we get into the spy the cues and volatility all showing the same things.
Maybe going to show off some of those indices as well. But get you guys daily expected moves for the spy the cues. We've already put out daily expected moves for all the stocks that we cover on the right side of your screen over here over on Patreon. But on Patreon, this might be kind of a refresher because I quickly quickly quickly in the last hour of the day saw these signals and I made sure to put out a statement about it.
I wanted to initially say early on in this video as we go into these signals, as we go into those shorter time frames, none of this is to freak you out. Nothing really here has changed. We have seen the good 2-hour confirmations. Nothing here is to convince you um of this or that or tell you to seriously react and give you that big fear-mongering.
None of it is about that. This video is strictly going to be about risk management and how trading like water really works. And that's how I want you to think about these type of signals. If you think the market's going to go way down, the big thing I think going into opex and going into a pivotal point with some signals we're going to bring up is do not get overexposed.
And that's what we talked about over on Patreon if you'd like to go check out that video. Um, even though it was hastily done, I believe we made some great great points that about getting overexposed in these areas. Okay, so let's just jump right into it. Let's go into these signals. What we talking about?
Let's get you guys daily expected moves first thing. Okay, 66739 to the upside. We see 65389 to the downside. Slightly bigger expected moves going into Friday. It is OPX, so we can expect some funky things. And there are some interesting fiveminute signals. I'm not the biggest on five minute signals.
But let's go over our 2our first. We have seen a 2-hour confirmation to the downside. This means what? We are very likely, very, very likely to go down and test these lows, go make a new one, maybe hitting that monthly expected move or a weekly expected move next week. That's why you subscribe because over the weekend, we're going to update these purple lines.
And just how we tagged one of them this week. If we end up seeing a new low here, we don't see that divergence confirm, we can easily go to next week's weekly expected move. So just be ready to subscribe if you find this information helpful. But we do see the confirmation from the MACD on a good confirmation, not the last bar of the day, a good confirmation with the price action closing below all those moving averages that we talked about yesterday.
Um, now we have to see is this signal going to fail, right? So you're always aware the market can do what the market wants to do just because something confirms there is still a probability of failure, right? There is still a not X to every single X if you have studied probabilities. So this means if the 2 hour is able to curl back up into positive territory, that would mean it is risky for the bears because you would be going positive and we actually have potential that this could be a higher low to actually go to what?
make a new high, start a new sequence, and we're back on that bull again for the rest of October going into November. I have to bring up these things. But once again, this is not to fearmonger you in or out of anything. This is just talking about things to react to. You would need to pay attention to these things if you are risking money in the market.
And that's the truth of it. That is how this signal fails. If the 2our is able to curl up, positive territory is there. So, it would be risky. Now, I'm going to go over the 30inut chart because something that could happen tomorrow is a Friday trap. The 30-inut chart here I wanted to bring up uh bring to your attention.
We already read off those daily expected moves. And Patreon members, don't you love that we were mentioning 667 and look at that 667 39 to the upside for that daily expected move. So, we're going to talk about this tomorrow is OPX. So, if on OPEX they want to sit this thing down in these areas and slowly get that up to these type of areas by the end of the day, that is a possibility.
We do see that the VIX is up by 22%. It closed up 22%. What does that tell us? Well, that tells us what do we have again that we had early on this week on Monday, right? Why why were we leaning towards some kind of bounce on Monday or Tuesday? Well, because we had a we had we had the VIX that was up by more than 20%.
So, if the VIX is up by more than 20%, that means that we have a 95% chance to bounce tomorrow or Monday, the next two trading sessions. So, I think that something very interesting here would be what if the 30 minute is able to curl up here. Well, it is negative. if it has the ability to go positive for a moment, but we will see if that resistance can come in at 667 as we have seen big confirmations for the what volatility on the weekly scale.
The macro for the volatility is still suggesting that we do have a very highly probable top here. We would need to see that 2-hour rotate up. We would need to see a new high to really believe that this thing can make a new all-time high. So why would I be looking for that 30 minute to potentially bounce right now early on in the day to 66739 to see some kind of 30 minute move up to here that then potentially fails.
Why would I be looking for a type of move like that? It's going to make a lot a lot a lot of sense as we get to volatility. So make sure to stick with us through the spy through the cues into volatility. We like to go pretty in-depth with the spy. But if you look at the five-minute chart we have some divergence here.
We have five minute diverg and and if you pay attention to this, when's the last time we had fiveminute divergence and a 95% chance for a bounce? It was right here. Okay, so we didn't confirm this at the end of the week on Friday, but we did confirm it early on. So, we still got that bounce. And weirdly enough, volatility, I believe, confirmed that divergence way back.
So, the last time we had a fivem minute divergence similar to this one, we actually got and a 95% chance we got that to bounce. So something that could happen here is an opx trap where the 5minut is able to carve out the divergence. Not very good on the MACD but you do see it very plainly on that RSI.
Very very nice. So it's not the strongest which means this one actually looked better than this one over here. So something we'll look for tomorrow is do we get some kind of upside move that then is able to set up some kind of high to rotate down that 30 minute. That would be very very nice for us to see.
But as of right now, it looks like these fiveminute divergences on your RSI, you can see it very plainly, pretty significant there, not necessarily the best for the MACD. Would say that early on tomorrow with those confirmations, if we're able to take back this high right here, make a higher low, we would see an extended move to 66739 would be the daily expected move according to the options data.
68% chance to land in this zone on Friday close. So, just remember that. So, I wanted to point this out. Now, the reason I'm pointing it out is because this signal is not only on the SPY, but it is on IWM. We see the same thing. If we blow up this RSI, we will pull it up right here. Boom. Divergence on the RSI on the DIA.
We see what we see not only a divergence, but the higher lows coming in, getting the nice curl down for the MACD. Um, so divergence there for the RSI again. So, we do have the potential to bounce tomorrow according to the fiveminute momentum and we do have a 95% chance for an update in the market in the next two trading sessions.
I don't know, we might end up seeing on Black Monday. We'll have to find out. Uh, so let's switch over to the cues, right, and get you guys daily expected moves, but I just wanted to put that out there. The 2-hour was not able to fully confirm. Now, it was able to confirm with the price action. it was able to confirm uh with the RSI uh but we're kind of holding ground here as of right now.
So something very cool about the QES is structure and we'll go over that in a moment. Uh why the 30 minute move to the upside could fail could be based on structure because a lot of people are thinking like left head right shoulder over here like we need to take out these lows bounce and then fail. I don't agree with that.
It looks like we are building building building liquidity for a big move and as volatility is suggesting that this is a top I would be worried about downside. Personally, I still believe that downside is the overall risk here, but we'll see if these signals can fail. Use the spy 2hour for that. As you look at the daily expected news, we have 60732 to the upside, 59266 to the downside.
Let's just go right into the 30 minute. We went over the spy pretty extensively. You'll see that we are close to the center line. So this would go like this, right? It would say, "Hey, the 2-hour confirmed down for spy. If the 30-inut curls up, that would be a violation according to the trade, right?
It might trigger some risk management if you did take the full technical analysis course that we have out there. But that being said, um if the 30-minut curls up, I really want you to look where that daily expected move is. Um it's really, really great. We already showed there there is five minute diverse.
We'll go back into that. Um, but if we're able to see this towards the end of the day and we're not able to really beat this high, go make a new one, but instead we actually see that as resistance, you can see that if we put a line across this low right here, right? We put a little line right there.
You'll notice that we did see this little blip below it. So this could be some kind of small head and shoulders within this consolidation within this building of liquidity to actually drop us to test this low and go make a new one go to that monthly expected move down towards 570 by the end of the month.
So I wanted to bring this to your attention. Why do I think that we could bounce going into tomorrow? Well, we showed off the spy. We showed off those other indices, but also the Q's have it as well, right? And we did get a rejection higher low here where we did make a new high at the end of the day.
That's great. Uh you would like to see this high taken out to think some real positivity can come. So you would like to see that extended move in the morning every maybe we even like gap up or something like that if this is going to take place. By the way, this is a big if, right? But uh calling a gap up is kind of difficult at times.
I don't think this one was the most difficult and maybe this one isn't the most difficult because you actually have signals for it. But um overall, you would like to take out this high. You would like to see some kind of what? Some kind of head and shoulders down here. If you really looked at this potential measured move, it would sky you up there, right?
We would see an extended move potentially to that weekly. I don't know if you necessarily want to see that. I think what you want to see here, if you want that Friday trap, is going to be we get that extended move, we pull back, people think this is going to drop, we actually extend it a couple more times into the end of the day, and then we see that drop towards the end of the day.
I think that would be the most interesting and that would really set up your left, your head, and then your right shoulder after you just took out this low just barely. So, wanted to bring that to your attention. It looks like the market is setting up for hey, a possible 30-inut bounce. And you do have a 95% chance of a bounce in the next two trading sessions.
According to who? According to volatility. Now, you're probably going, "Hey, there's no 30-minut divergence for volatility." This is exactly my point. There is no 30 minute divergence here for volatility. What does that overall tell me? That tells me that a 30 minute move to the upside isn't matched, right?
The there is no 30 minute divergence saying that this is a big reversal moment for volatility. Instead, you have the positioning of the MACD very high up. You do have the ability to get down to that center line and then curl up into positive territory at some point. Now, does volatility have the same signals that suggest a bounce tomorrow is very possible?
It is up 22%. 95% chance for a bounce. Yes, it does. So, we haven't fully I would say we have confirmed these, but we're trying to unconfirm it right now. We'll see if we're able to scale up, but you do have those divergences here. You even have it on VIX. I think you might even have it on VIX 9day.
You just see divergence all across this. So it looks like a potential bounce tomorrow could be the opportunity. Um that would tell us a 30-minut bounce is very likely. Now once again according to volatility on the 30 minute it says we are going to come in and test these highs. I have marked off 2151 is just a level that I had marked off originally.
Um but that is a level that I want to watch very closely. Right? I want to watch that very closely. This is a random line. That was my 20% line. I wanted to see if the market would uh or the VIX would close up by 20%. So, this tells us that we could come back into 2151. We could see that pull all the way down to that center line just like we did over here, right?
We could see it pull all the way down to that center line, take its time, and then see another curl up. And I believe that is where we really want to pay attention, especially on a Friday OPX for any kind of trap. We will also be paying attention if the VIX is down by more than 10% or down by more than 20% tomorrow because that'll give us a good hint of can we see extreme uh or see a down day on Monday or Tuesday.
Now there is one thing that I will mention at the end of this video and I made sure on Patreon I hope I clarified that. Well, I'm not leaning towards this but this channel I have to be very honest about the signals that I see. I have no I don't want my bias to leak into this. Um, most of the time I try my best to keep that out.
So, I want to show you this right here. This is going to be a signal that suggests that we could be seeing the daily chart curling up to go make new all-time highs. I'm going to click on the 2-hour chart. We have a 2-hour that the MACD is very flat right now. It's just showing, but it is something to keep your eye on.
If the 2-hour is able to curl down, right, we're able to see a big flushing moment and able to curl down. And I would actually even say uh confirm possibly below the 5day moving average which the 9 or the 9 on the 2h hour and the 5day moving average are very close to each other right now. You would look for that confirmation that we're losing the uh 5day and then make sure that 30 minutes not whipping back up.
But this is potential potential divergence forming uh you have it forming here. But I don't I don't necessarily believe that this signal has much credibility to it. And I want to be very honest with you about that about my sentiment towards it. As someone who has looked at this for years and years and years, I don't like how this really shapes up, but I feel like it is something that you could pay attention to as far as risk goes.
So, let's talk about risk as we get into the end of this video. Okay. As it stands, why am I stating this? Even though I drew out that I think that this head and shoulders is going to end up falling down for a weekly pullback. Well, because it can we can really take our time. We can see those bounces on Friday.
And so, I've been able to really do some good things with those volatility options. I'm seeing people bet big in both directions at exactly the wrong times. And that's been very, very good premium for me. And so what I'm doing is I'm just holding those runners to the downside so I'm not overexposed to downside one because of that small little signal I just showed you on volatility on the 2-hour saying, "Hey, we could have the daily swing up here." And that's not a risk that I want to play around with.
So I'm not going to overexaggerate. I'm not going to try to make a million dollars on some kind of crash. Instead, I'm going to trade like water and keep making money on these ups and downs while people keep trying to guess which way it goes. And then I'm going to keep my runners for volatility because I believe we're heading in the downward direction.
That being said, I want to make sure to be diligent. I want to be trading like water. I want to be assessing the market at all times while volatility is higher because I can make good money throughout. But I don't want to sit there and be overexposed. I don't want to be overexposed to especially with this guys, especially with this president we have.
I mean I that's not me talking badly about a president or anything. I'm just stating facts here. If he tweets something, the market can go like this on a Friday. If he tweets something, the market can go like this on a Friday. So, why am I placing my house? Why am I betting the house on things trying to make a million dollars when there's been great little trade setups all week long and there's a great little trade setup here for a potential good little bounce that could be like a good little trade to 667.
Why would I risk that? Okay, I wanted to point that out and that's why I overall sat down to make this video even though we already updated you on these things on Patreon. So, I I hope that you understand what I'm trying to get across here. I still have the same sentiment towards the market that I had a couple of days ago.
I still have that head and shoulders that is drawn up right here in front of us. We resisted off the weekly expected move. We rejected off of this supply zone in here. We have the potential for a Friday trap is all I'm getting across in this video. And I have some things for you to pay attention to within this video if you need to watch it again in case we do see something a little crazy.
But I'm not going to sit there and overlever myself and overexaggerate trying to make a million dollars when Trump could literally tweet something and then it all goes wrong. So, um, wanted to put that out there. I hope that it is helpful to you. I hope you guys have a fantastic Friday. I might be a little bit busy tomorrow, Patreon members, but if you guys would like to join the Patreon, it is down in the description.
We try to give out some information during market hours. We even talked a little bit more about Target today with that weekly divergence if you're interested in some investing. That is something that I've been talking about. But I just hope you guys have a great rest of your night. And I hope that you guys have a great day tomorrow.
And make sure not to do anything silly, right? Make sure to set yourself up to have a good weekend where you can just enjoy yourself. You can really pay attention to what's important in life. That would be your family, your kids, your friends, your loved ones, and even yourself. I mean, at the end of the day, yourself.
Go treat yourself. Make sure you're fully getting a good weekend where you cannot look at markets all day long, but maybe you just come back, you see our weekend video, and you go have some fun with friends. . Thanks for hearing my casual usual end of the video spiel, and I hope you have a good night. All right, guys. Peace out.



Comments 0