
저자: 미상 · 외국인
요약 보기
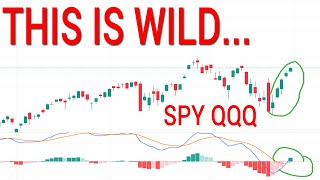
연구자는 월간/일간 예상 변동 구간을 제시하며 SPY·QQQ 단기 흐름을 기술적 분석으로 설명한다. 2시간봉 하락 전환 신호와 30분봉 다이버전스/저점 낮아짐을 주시하라고 하며, 2시간봉이 하락 전환하면 시장의 단기 고점이 될 수 있다고 본다. 다만 대폭락을 단정하지는 않으며, 2시간봉 상승 지속 시 10월 상승을 시사한다. VIX는 1504 부근 다이버전스를 기대한다고 언급한다.
다듬은 글
Two updates in one day. Are you kidding me? Well, in this update, you're actually going to get some updated daily expected news for tomorrow. I'm sorry. I have been gone. My neck has been killing me. My back has been killing me. Haven't been able to sleep. Had terrible migraines, but we are getting better.
So, thank you so much for your well wishes. I really, really, really do appreciate that. In today's video, I want to give you guys some daily expected moves for tomorrow. Very small range for tomorrow. I wanted to discuss what is going on with the market and is the risk gone at this point? Are we going to mega squeeze or is this just every last drop of FOMO that we can get in the pot possible before something very disruptive takes place?
And sadly enough, the second one, the latter, will more likely be the case here as we continue to look at these signals. So, let's go over these things today. I know we put out a video earlier today, so some of this might be a brief update for you. Uh, but getting daily expected moves is always important and always getting a refresher during the week is good, right?
And hey, you know what? How about this? Let's just read off those monthly expected moves first. Okay, yellow lines, guys. If you don't have the monthly expected moves, these will be your 68% zones uh for the spy and the cues. We're going to give those out for free today. If you want them on Patreon for all the other stocks that we do cover on this channel, including things like TLT, GLD, a little few other things, uh you can join by with the link down in the description.
All right, the monthly moves though, the upside move for October is going to be 69053 to the upside, 64,183 to the downside. These have spread out. That means what? According to the options data that I have calculated this with um more people are seeing bigger swings for October. So, we have a bigger move priced in for October.
So, the expectation is to see a big move, but in which direction? And that's where we're going to do our homework on the shorter time frames. go into the 2-hour chart. The daily still showing that divergence, but we want to see if it creates that next divergence point. And wow, we are creating it. By the way, if we talked about this in the video earlier that we might just need to see two days of up, set a trap on Friday and absolutely smash this dang thing.
Um, for now, sorry, I got excited. I'm excited to be back with you guys. I got to get on the two-hour chart. I got to stop skipping around so much. For now, the big signal that I will be watching is does this 2hour stop in its tracks? That's going to be a big deal. This will tell you a lot about the market.
Just this 2-hour move when it stops and when it starts again. If this is going to stop abruptly, we sit in this area. We make a little double top type look on the 30 minute and we see this tumble. That is a bad sign for the market. Remember we were discussing trap number one, trap number two, and then down here we looked at the signals and we said, guys, we have to be prepared for a trap number three in the form of a lower high or a divergence point.
So looks like trap number three is forming at this point. I wanted to come out and say that this is trap number three. So for your daily expect moves for tomorrow 67114 to the upside 66576. Not a lot of implied volatility. So what can we do? Well, if this 2 hour is able to raise that floor, wipe out divergence, then what do we have to do?
We most likely will be remaking those signals, which means more up into October. But if we're going to see this thing collapse and we're going to get this two-hour to turn down now, what are we looking for? If you took the cours, you would know what chart I look at to um tell me, hey, is the 2-hour very likely to turn down, give us a few hints to see if it's highly probable.
We see that the 30-inut chart is what we would watch here. Once again, that is down in the description if you want to check it out for yourself. We will be having a sale very, very soon, so be ready for that. But we do see that the 30-inut chart wiped out divergence over here. Um, no lower high or anything like that.
It looks like what we are getting here is potentially this look. Okay, if we start to see this look, that's going to be a bad sign. Now, I wanted to suggest uh to pay attention to a 30-minut divergence here. But remember the first part, if the 2-hour squeeze is too much, we raise the floor for October.
Right now, if you want to see weakness for this uh two-hour, if you want the two-hour to cross down, you would like to see some kind of what? Some kind of lower high or some kind of, and I always lean towards it, especially in the real FOMO traps, some kind of divergence. And that could take place into the end of the week, that could go early next week.
But, uh, we have run all the way into September 30th. If we squeeze higher, okay, that's fine. We are obviously squeezing based on the five-minute chart. If you really look at the five-minute chart here and you look how we're just going up, up and up, you can see that this is coming down, down, and down.
We are just squeezing to the upside today. So, big deal. So, pay attention if this is some kind of trap my Friday by October 3rd. Once again, what am I looking for? I'm looking for something that can turn the 2-hour down. If I don't see the 2hour able to turn down and it blows out those divergences, I should expect a 2-hour pullback and for continuation.
So 2 hour goes through the sky a little bit here. We go up like this. We pull back on the 2-hour. We continue for a bit of time in October. But if we are able to create those reversal signals on the 30 minute, which I will drop right now, these would be a great hint. And since I am leaning towards this one, I am leaning towards some kind of divergence on your MACD on your RSI at the same time.
So, this is the exact type of look that I am looking for from the spy to tell me if there is going to be some kind of highly potential top on Friday. And I hope that this is helpful to you. Once again, these videos are just out there to be helpful. These are things based on my knowledge in the stock market, based on my history in the stock market, the way that the stock market likes to move.
And all I'm trying to do here is to get you to hopefully understand that or give you something helpful for your trading. And so, what we're going to do next is we're going to go over the cues, then we're going to go over volatility. So, let's hop over to the Q's. We do see the Q's. If you need the monthly expected move, let's make sure to get those for you first.
Monthly expected move for the Q's. Once again, 68% zone. We use the options market to calculate this. 63034 to the upside. 57042 the downside. One thing that would be really interesting for us to pay attention to, just another uh small little blip here, we're going to do the monthly update soon over on Patreon, but we were discussing how we might need to make at least some kind of divergence up here because this just wiped it out on the daily.
And it looks like we're potentially going to go do that. We'll see what happens over the next couple trading sessions, but we're going to look out for some stuff here. But I wanted to talk about something different just for the cues for a brief moment. Okay, if this is going to be a correction, um, when we get to volatility, it'll be suggesting it'll be a weekly correction.
So, if it's not going to correct now, whenever we start to correct and you see a monthly expected move, highly expect bounces from that area. In fact, if you notice that if we're going to go through an actual correction, we most likely will get one downward move from the daily, some kind of upward move, and then another downward move from the daily.
And that could create potential divergences. That happens a lot of the time or those higher lows. I mean, if we just go back a little bit here, uh, we see we actually went down, crossed up, went down, crossed up, almost curled back down, right? So, something you can pay attention with the monthly expected moves is for this first one, um, if we're able to get down to this level, you would just be expecting most likely a bounce because we will be significantly negative.
I just wanted to put another blip out there, but there's your monthly expected moves. Here's the daily expected moves for you real briefly. We do see that we have 60657 to the upside 5993. One thing I am very happy about as far as last week's analysis is our read on the Q's. Our read on the Q's was so so nice.
We go the SPY is showing it. VIX is showing it. But why are the Q's not showing it? They normally show them all at the same time. We noticed there was no divergence on the MACD, no divergence on the RSI. You can go back a few videos and look at it. It was just it's a great read because we were like we will be paying close attention if the 30 minute comes up pulls back goes into positive territory.
So the two is crossing up by the center line. This means what? It's not extending far right. So if this 2hour cross down what do you have now that you didn't have when we were talking about it back then you would have that potential divergence point. I want you to look how significant that would be.
Now, do we have the 30 minute hints uh for the 2-hour to cross down a divergence or a lower high uh for the Q's? The Q's, weirdly enough, oh, that's very close. That's very close. So, what could end up happening here is since the Q's already have the divergence point, they could go through a bigger period of weakness and they could actually set up a lower high on Friday while the SPY sets up a higher one.
But also, you just always want to be watching for a third divergence point. So, I would just say for the Q's, paying attention to a 30 minute pullback that leads to a lower high would be a great way for it to reverse around. But let's go over to the VIX for a little bit. This is pretty set in stone.
The SPY is going to be easier to follow, I think, than that. The 30-minut looks like it wants a reaction up. Once again, this is negative. We would need to see a big reaction here. The 2-hour just crossed down. So, hey, the way that we cross down here, the way that we see big volatility come in is if we don't do what I think we're going to do, right?
We just turn up that 2hour, we start to go, go. These daily signals have been telling us for about a week and a half now. Yeah, volatility is about to explode. The weekly chart is about to cross up into what potentially going positive, but that will still lean towards a lower high. So, just be aware.
Not calling some kind of massive crash right now. we'll talk in 2026. But um what I wanted to figure out was the the the SPY doesn't have those reversal signals. The cues haven't confirmed their reversal signals. So I think it's a high possibility that we actually see the market or see the VIX curl down to these type of areas and set up a divergence point around my 1504.
That is what I'm looking for for volatility. But overall, as long as the daily chart isn't completely turning down for volatility, as long as the daily chart isn't making new lows, like absolutely collapsing down to here, like right curling down, let's put it simply. If it's not curled down on the MACD, then it's still up above what?
It's above the five. It's above the nine. It's above the 20. Uh this is still a very risky signal out there. So, I just wanted to really get through these and and I'm excited to be back and talking. So, I'm sorry if uh if this video wasn't the absolute best. I'm a little too hyped today to really uh I guess talk clearly, but I really do appreciate you guys watching these videos.
I think the community, it's a very very fun thing. I'm hoping to start some new stuff, start up that sale in November like we normally do. And Patreon, I will have a monthly update video for you. For today, you need to be paying attention to going into tomorrow, going into the next two trading sessions, the 2hour chart turning down.
What do we look at for the two-hour chart to turn down? We look at 30 minutes, right? We look at the 30-inut chart. We look for a divergence. We look for a lower high. Either one of those tells us that the two is highly probable to turn down. And when that 2hour turns down, I think that that will be the absolute top for this market until we see a corrective move of about 10 to 14%.
. I hope you have a fantastic night and I will see you guys in the next one. Peace out.



Comments 0