
저자: 미상 · 외국인
요약 보기
연준 금리인하 이후 시장 변동성 확대를 전망하며, 두 번의 함정(trap) 구간을 거쳐 9월 말 이후 단기 고점 후 2026년 상승 재개를 예상. 금리인하가 경기침체 우려보다는 정책 요인이라 판단. SPY 30분봉·2시간봉 다이버전스와 VIX 변동성 반등을 근거로 제시. 사회자가 추가 개별 종목 분석은 보류.
다듬은 글
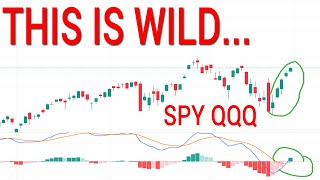
Is trap number one done? Because as we look at this market and we see a dip down into the area where we were suggesting that trap number one could be done, maybe we were able to get that through with over the last trading session using the Fed interest rate decision, the Fed as an excuse to heighten some volatility to get to some critical levels.
But if you love daily expected moves, man, you probably love them today as we give you updated ones in just a moment. But today we need to be talking about the fact that we talked about two traps being set up here and is the first one done. We're going to get into that as we get into some technical analysis and talk about some things going on with the market and these rate cuts that we just received.
So let's get into it. So the very first thing I wanted to do before we get too far into things is just look at the probabilities. Right? We were discussing this what almost two months ago? I think it was two months ago. I think it was July. we were suggesting that there was going to be a 25 basis point cut in September.
And then when people once that actually came to fruition and people started to realize that that was going to happen more towards the later stages of August um a month after us and then after that they started to notice the 25 basis point cut. They started to say, "Oh, we need 50. We need 100. We need this.
We need that." And I just said, "Hey, let's go check the probabilities." And they said 25 basis points. It's always good to not listen to the crowd, but just understand that the crowd will be shouting out things that don't make sense. So, let's make sense of the rate cuts from here forward. You notice that we have going into October, we will have a uh 87.7% chance for another 25 basis points cut.
And then as we get into December, we will be looking at an 80% chance for another 25 basis point cut then. So this is very important and I think something to discuss here is is what is going on with these rate cuts. Are they going to lead to some kind of crash? Are we cutting rates due to weakness in the economy, the recession coming or is this going to be a rate cut cycle because of pretty much like something to do with tariffs or something to do with Trump really wants them at this point?
I mean, I think that's a very very good point to bring up. Pretty much it's are these rate cuts because we want to see those rate cuts and we want the economy to do better. We want the rates to actually drop to benefit people for the short term as we see the problem most likely get worse and worse into 2026 and 2027.
The early rate cut can cause some problems as people think it is because of the weakness in the economy. We know that the market or at least um the people who participate in our markets in our actual economy still have a little bit of strength left and they like to buy time into a big crash for as long as possible.
So that is why if we do see a disruption after these these rate cuts, right, if we see disruptions during the time where we are cutting rates, it is very likely that that will be a pullback that resolves itself to the upside. So, I just wanted to point out that the rate cuts might be coming down the line, but it's important to point out if we were actually cutting rates due to a potential recession or some kind of collapse right now.
If you see people saying collapse right now, we would see higher than 25 basis points and we would not be waiting another month to cut that next one and we wouldn't be waiting two more months after that. We'll see how things change, but it's important to understand what is going on with these rate cuts.
It looks to me not in line with recession as of right now. Now, I think recession could be coming down the line, we can talk about that on Saturday as we pointed out 2026 and 2027. But if you were um subscribed to this channel and you watch a video from just a couple days ago, which now you are due an update for YouTube as we've been updating Patreon, we saw that in this area, we can pull up the thumbnail and everything if you want to look at the previous video.
We were suggesting that a 2-hour pullback down into this area right here would be very very good. And that's what we are calling trap number one. And now we have to see if we are going to be done with that trap and are we going to go set trap number two which I believe will show its face as of next week.
And after we do see trap number two, we will have the perfect reversal signals aka divergence or a lower high, right? to tell us that the daily chart is going to cross down, which the daily chart does show a massive amount of divergence there as well. So, if you wanted my overall take for the market right now, I believe that we are going to see an absolute top here in Rectember.
It's going to get pretty dang ugly for a bit of time as we do see those rate cuts come in and people wonder if it is due to recession and then we are able to balance that out, base out and able to go to the upside in 2026 for another weekly move. So, I think we're going into some volatile times here.
That's proven from volatility. Make sure to stick around in just a moment as we get into the VIX. It will clear things up pretty pretty well. So, for the time being, it's very very nice because the 30-inut chart, let me get this off the screen. That's for something else. The 30-inut chart here looking pretty nice.
Why? Because it's right by the center line, right? So, we can treat this very simply as we get the daily expected moves. We can see 664 66 to the upside, right by that monthly and weekly expected move. And we see 65370. That tag of the lower move was very interesting today. But look where the 30 minute is.
It is right next to that center line. If you pull out to a 15-minute chart and zoom in on the RSI, you are going to see divergences here. So it is pretty probable here that and the momentum here is saying all that has to happen is the 30-minut curls up and we are going to see what the test of these highs or making a new one and that's where we would pay to the top side expected move.
What I assume would happen here if we are going to create the trap number two is we are going to build up to these areas. We are going to see a 30 minute drop down. We are going to see another 30-inut push and then we are going to see a 30-minute divergence. That tells us exactly when the 2-hour will drop down.
If divergence is what needs to be created, the first thing that needs to happen here is if the 30-inut can curl up, we need to see a move to potentially 664 is what I would say. As it stands, we see the two-hour chart has pulled back. I'm wondering if we are able to see a little two-hour divergence right here over the next few trading sessions.
And then we actually see that two-hour divergence show its face here. But this could not be done, right? I wanted to mention that towards the end of the spy discussion that this doesn't have to be done. The 30-inut chart has not confirmed yet on the MACD. It has done it for the RSI and I bet a lot of people with the 15-minute divergences have taken plays to the upside, but the 30-inut needs to show us that momentum to the upside first for us to be convinced that it can go to 664 or the uh weekly expected move by the end of the week.
So hopefully you understand what's going on here. It looks like rate cuts can be kind of a back and forth as people figure out is it because of recession, is it for policy, is it for this, is it for that. But the main thing you need to understand right now is we don't see enough weakness in data. We don't see enough spending data that is really bad to justify this being recessionary at this exact moment.
But this could be the first stages where we build up to that moment in 2026 2027. But if you just wanted some insight into tomorrow, it would be if the 30-minut curls up, you are very likely to test these highs, go make a new one. And this is where we suspect we are going to create trap number two, which we will look for a 30-inut divergence to the upside before that is able to subside or a 2hour divergence or lower high to tell us that the daily chart is going to cross down.
Now, that was a lot. I know it is a lot, guys. I've told you in my video uh my previous video actually from this week and a couple videos back I believe too from the weekend. There is so much that we could go through, right? There's so much that we could go through. But something that I like to do for people is just pile in and go, what do I think is necessary to not confuse a bunch of people, right?
All kinds of different people uh watch these videos. All kinds of people look at money differently. So, I'm going with what I see as the most helpful kind of things that I can bring to your attention without confusing you with every single thing going on. So, the cues right now, we do see the daily expected news of 59659 to the upside.
You see 58341 to the downside. The 2-hour has crossed down, right? We have not made new highs. Have we seen the 30-minute curl up? It actually did. It tried to at the end of the day, but this is is this a good confirmation? You would say so for the RSI. You would not say so for the price action, and you would overall not say so with the MACD as it stands.
U actually, no, I'll give it to you. I'll actually give it to you cuz it's not a positive bar. So, the MACD and RSI are suggesting it's all right. Um, and this is close to the center line, but the price action here, this is a negative bar. So, from the previous bar, you notice that this one is negative.22%.
So, this isn't the best confirmation. We would like to see a solid confirmation in the morning, and that would tell us that we're likely going to test this high right here or going to go up to our daily expected move of 59659. So, that's very, very key. If we are able to roll at some point, we will be paying attention to um these moves critically, right?
These things can change. this whole video can change in a matter of a couple of days. So, we will update you frequently on YouTube and even more frequently on Patreon because we want to make sure that this is actually trap number one. Uh the reason we want to make sure this is trap number one and I'm going to discuss with you about it because I think it is good for you to understand why I am suggesting I know we just showed how it could be trap number one on the spy.
Let's talk about if trap number one has not shown its face yet. Okay, this would mean that we are going to get some kind of reaction here and then we get a 2-hour pullback, right? And then we actually head to the upside into the exact end of the month and that is where we create the signal because we have so much room to the downside here.
It's very very critical uh to understand the positioning of MACD's very well. So if the 2-hour is able to come all the way down here and make the divergence here, how close are we to the center line? Very very close, right? So that would look very nice and we're going to be aware of it. But if we would do what we discussed on the spy and create that very tightly right here, right?
Say we just create a little divergence point right here and then we start to fall. Look at the room we have to that center line to remain positive which just invites more curl-ups. It invites triple divergence. So we still could leak this thing out to September 30th. I am going to continue to pay attention to markets very very thoroughly to tell you when I think hey this is a very very probable time for this to be a top but as of right now we have not seen the 2hour what we have not seen the 2hour divergence even the little one right we haven't seen this one and we also haven't seen this formed one right we haven't seen the extended one into next week and we also haven't seen any form of lower high yet we need to see the losing of the 5day and the rejection right here And then that will be the most likely time where the daily chart will confirm down.
When the daily chart confirms down, that is when we can start saying, okay, we are going to get the weekly pullback cuz that's what overall we are discussing um for the market for now is this has been a hell of a run. We got to thank you thank God and thank everyone for our skills that we've learned here.
But we see that that is done and we need to pull back and then we are most likely to see another upside move into 2026. And this is where it is very good to watch to the volatility portion. So I appreciate you guys coming in and watching to the end. It's great. I'm still trying to put together some time to go through individual stocks.
I just don't want to look at them at a flash. like this is going to be a critical volatile moment uh for the next week or so where we can see some funky things. Um even even now this week you're seeing it, but I don't want to just click into a stock and sporadically give you my take on it. I don't think that does it justice right now.
One stock that I'm looking at for a 2-hour bigger pullback is JP Morgan if you were aware. So if you wanted something to look at, we see here that the weekly chart for volatility, this is what is being suggested to cross up. What is suggesting we are going to see weeks of volatility possibly going all the way into December, right?
What is suggesting that the daily chart? I mean, look at the confirmation of this divergence. We're just reminding you of it. I'm sure you're sick of hearing me talk about this divergence, but we're going to go into the shorter time frames. But in case you're new, in case you need to be refreshed here, there is daily divergence all across this and it's really close to the center line.
This is where it goes. Yeah, we can leak this out into September 30th, but it's very likely to head sideways or barely up into September 30th. And and it's pretty much from now to September 30th. You look for that 2-hour divergence. You look for the 2hour lower high from the SPY because the daily divergence here tells you volatility is going to turn up and we are about to see a big retracement.
We we could see a retest of 600 if we wanted to over the next two months. That's how crazy this signal is. Now for the 2hour, this is what we were discussing and why we think that trap this trap number two could literally be on Friday with the monthly expiration because I was suggesting that the 2-hour chart was going right.
Go back to the video. We were right here. I said the 2-hour chart could explode to the upside, get a 2-hour pullback, maybe down to 1504, and then be able to curl up again. Now, we're in these moments, and you see that we are doing what? Sorry, I thought I heard something outside. We are up. We saw that MACD extend.
We are well in positive territory. We can pull back and then we can see, oh, what if on Friday we start to see volatility pick up again. This is going to be something to watch for anytime the 2hour chart is able to curl up again in positive territory. I would be a little bit cautious with any kind of long play with volatility.
Now, as it stands, you know, we need to see that 30 minute chart for the spy curl up, but volatility could get a bounce off of the um one across the center line here. So, we do have an opportunity if this crosses up early on tomorrow to test the high, go make a new one. The trap number one could not be finished, right?
We might need that to extend down to the center line first. All right. But if we're able to curl up here and make a lower high, right, lower high, and then we curl to the downside, it is very likely that that trap is done and we are going to see a test of 1504. I will be looking out for divergences uh down in this general area.
And I do not think that the daily chart will be able to cross down again, but if it is able to, it's fine. It can still go do these type of things. As long as we are not going through the floor with some kind of squeeze, then everything is okay. So, I wanted to point these things out to you guys. I was trying to describe them as as simply as possible, as unconfusing as possible because we do have a lot a lot a lot going on.
So, I'm going to summarize it at the very very end of the video. As of right now, what were we talking about the last few videos for some kind of top? We were looking for a 2hour trap to the upside, two traps really, one here and one here for some kind of two-hour divergence or we were looking for a a lower high from the 2-hour.
And we have not seen those things yet. So, we can't conclude at this exact moment that we have a top. In fact, we would actually conclude the opposite. We would say looking at the MACD, it is very likely that even if we wanted to pull back for some time again back into this wick, right? If we wanted to keep pulling back for some time and as long as we're by that center line and then we curl up, that is when we can make the next move to the upside to test the high, go make a new one.
And this could continue into September 30th as it stands. So, we are looking for the two-hour divergence or the 2hour lower high and that is going to be a big deal going forward to see if the daily chart is able to turn down and maybe I can buy some volatility once I do see that signal. So, I wanted to say thank you guys so much for liking, subscribing, doing all that good stuff.
You guys are fantastic. I really appreciate you guys coming in every day, watching these videos, and liking them. Like I said, I'm just trying to be as helpful as possible. And with everything going on here, I'm having to have some serious discernment and be like, "Hey, let me really try to pull away from it and give you guys the most helpful things that I think can actually help out your trading or your outlook on the market for the weeks ahead." So, I hope that this is very, very helpful to you in some way.
And if you want more information or you want some weekly ranges and things like that, daily ranges for Friday, you can join Patreon. The links down in the description. Thank you guys so much and I hope you have a wonderful evening. Peace out.



Comments 0