
저자: 미상 · 외국인
요약 보기
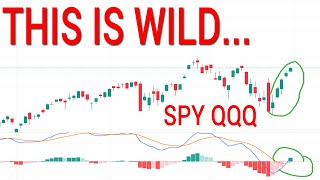
9월 증시는 '함정(trap)' 가능성이 있으며 SPY는 이상치로 보이고 QQQ는 9/30 전후 하락 위험이 있다는 주장. 2시간봉·30분봉 RSI/MACD 다중 다이버전스 근거, 일간 기대변동폭 상·하단(SPY 66080/65446, QQQ 587.88/580.28)을 제시. IWM은 220~217 부근 하락 가능성, DIA는 다음 주 FOMC 전 마지막 함정 후 하락 가능성 언급. 변동성(VIX)은 바닥 유지로 하락 전환 신호 해석. 2026~2027년 중 큰 폭락 위험 경고.
다듬은 글
Welcome, welcome, and thank you for clicking on my video. I'm sure a lot of you guys are thinking that this is the mega squeeze that is going to raise the floor, but the truth is the game is the same. Nothing has changed here. We are still going to slowly head up or slowly head sideways into potentially September 30th or we are going to set up a trap, which this very much so looks like the beginnings of a trap, especially as today we get into this video because we are going to go into the other indices.
You'll notice that the SPY is an outlier right now. And so, as we get into those other indices and as we look at volatility, you're going to see how this could very likely be some kind of trap. And so, we need to get into that technical analysis. And early on, I do want to talk about the data that we've gotten over the past couple of days, over the past week or so.
Right now, the Fed is in a really tough spot because the jobs data was all fake, right? And they said for years that that jobs data was the only thing keeping them from cutting rates. So, they should have been cutting rates for a long time. Um, but that actually would have been a bad thing, too. They're in such a tough spot because if they cut rates, well, then inflation goes like this.
Wham, wam. Inflation is not below 2%. But if they actually keep rates steady or raise rates, well, then the unemployment problem goes ram ram. So, they are in a tough spot. I am very happy not to have their job, but I'm very happy to talk to you guys today about how this is potentially a kind of trap for the market, at least potentially for Friday or going into next week.
So, let's get into it. And I'm just going to go right into it because I don't have a ton of time. If you want to stick around for the end of the video, I will have a short little thing that's a little off topic from the market. As we look at the two-hour chart here, we notice that we still have the potential for multiple point divergence.
So, we're seeing if the market can turn down on this 2-hour chart, right? We were looking for that 2-hour diverse to fall right here. Didn't quite happen. So, we're leaking this out, but we have to check on those other indices and look at volatility, right? Volatility should be completely wiping everything out if we're going to raise the floor here.
Uh the 2-hour rolling down here, it still can be ah not quite that much weakness. So, we do have the opportunity to see a two-hour pull down that can leak this out into potentially that Fed rate decision next week. that would take us into opex as well. So maybe we're just going to head sideways into September opex and not necessarily the quarterly opex all the way over here.
The 2-hour chart is very likely to cross down, but the 30-inut chart is telling you why. The 30-inut chart is showing the divergence on the RSI, triple divergence, not on the MACD at the same time. So kind of a big deal there. Um, so let's get you guys some daily expected moves and talk about the weekly ranges.
How about that? We see here that to the upside you have 66080. To the upside you have 65446 to the downside. Notice we are outside of the purple line. That means this is our 68% zone. We are outside of it which means you have a 68% chance to close back down in this by the end of the day on Friday. This would be the most probable zone to close in.
It would be very cool. It's always very cool when you close in that area. But uh the 30-minute divergence on the RSI triple divergence actually is what I'm including in there is a very very good thing to pay attention to at this moment because it means the 2-hour is at least very likely to pull back.
And then if we see this 2-hour get by the center line, we see that thing cross back up. Hey, we could potentially have another swing trade for the bullishness to continue maybe all the way up to that monthly expected move. Now, this is very very good. We we look like we're going to pull back. We still have the daily that if that just flips back down, which that two hour still has multiple point divergence, you could see a top in this market going into this weekend and so many things crazy happening in the world.
Uh I wouldn't take black swan in September off of the table over one of these weekends. Let's put it that way. Let's go into the Q's real quick. Q's have crossed up on this MACD, but but you notice the Q. This is why I'm saying the spy is kind of an outlier. Like this looks terrible. The spy is doing something, but I think it's just to give you a big number to bait you into FOMOing to thinking this market's going to go up 10% from here when it's way more likely to go down 10% from here.
Sometime in September, we're going to wreck this thing. It's going to happen. And uh if this daily crosses down, that would be a good signal to watch out for for the Q's. The 2-hour chart here, is this thing very likely to curl down? Well, you do notice that the Q's here, um you can at least see it in the RSI on the 2-hour, they don't necessarily have that divergence point.
So, we'll really pay attention to if this can leak out for a few more sessions, maybe going into Wednesday, Thursday. Give us that left head, right shoulder. That'll be easier to see on 30 minute charts. But let's just do this. Let's get you guys some uh daily expected moves first. 587.88 to the upside, 580 28 to the downside.
The 30-inut chart here is what's really interesting for the QES. They are holding holding holding all of the weakness here. Triple divergence on the MACD, triple divergence on the RSI at the same time. And it confirmed at the end of the day, guys. So, the very probable daily expected move to tag tomorrow, barring the data in the morning, right, is going to be that 58028.
If we're able to lose that, see some kind of bounce into next week and roll, we could start the downturn as soon as next week. So, just be aware of that. If you wanted a great confirmation for just like, hey, are we actually going to downturn here? When are we actually going to pull back? Maybe I just want to buy a two-month option uh to hold on to for a couple of weeks.
I'd be looking at the daily chart to see when that confirmation comes in. That would be a closing below the 9-day moving average where I think that the cues will back off all the way to the weekly 50, which is sitting somewhere around 520 is overall what I am paying attention to at this moment. But I just really wanted to point out how yeah the spy did something and it's making the signals all weird but still fine on the Q's.
So the Q's are still in an interesting spot. Now uh the other thing that we can pay attention to is the 2-hour chart for IWM. Yes, you are getting this to violate one divergence point, but you have so much weakness and momentum here. And you'll notice this when we get to volatility. Volatility did not bust through the floor when this these things happen, right?
IWM is still holding all those divergence points. IWM is still saying, hey, the daily is struggling to get going here. Very flat across the way. So, this could just be the last trap before you actually turn down where IWM is actually very likely to go down to probably a weekly 50, right? Right around that 220, 217 area, I think looks very, very good.
But I just wanted you to notice that the divergence is still here for IWM on the 2-hour chart. Like, it's not getting rid of it like it seems to try. it's trying to do with the spy. So, you have to be prepared for something wonky to happen in this market. This market is most likely seeing an uptick to get you to buy something and it's going to end up being very, very rough.
So, we do see the same thing for the DIA. Some choppy signals, but overall still holding the main points. This is very different from the spy. So, the Dow Jones, the DIA is what I like to look at for the Dow Jones. We're noticing what we notice 2-hour divergence still possible there. Still curled up.
So maybe we have time to bait that out. Let's look at the 30inut chart. Very flat across. So I think it is very likely we do see that final trap, right? Maybe we come down into this area. Great buyers in here. I don't think this is the proper move by the way. Uh this is great buyers in here. We retest off the five.
We see a curl up into next week. We make a new high and then we actually fall down. DIA might be a great one to watch uh for next week going into uh the FOMC or whatever whatever we do have. I'm pretty sure we do get that rate decision next week correct. Let me get the actual date for you right here.
We have Wednesday, September 17th. So the 17th would be the time to watch out for that. Now the last thing that I was going to do was bring up volatility. Now if you were on Patreon, you probably saw me say this and maybe I think I said it in the YouTube video. I'm looking out for that divergence that would form right here.
I said this right over here in this time frame. I was like, "Hey, I'm looking for the divergence point right over here. I even posted it to Patreon. We see it. We violate it back down. This is perfectly fine at this point, right? I'm not out of my volatility calls. Bought them right in here. Scaling into them now.
That's what's happening for me. 2our is extreme divergence there. You'll notice we had two-hour divergence here. What ended up happening?" So, we have two-hour divergence here, giving you what? giving you a higher low for potential higher low, let's say it that way, because we don't know tomorrow's price action yet for VIX.
And I think that this is very very likely to turn around. I highly doubt that these divergences are just going to go away all willy-nilly all of a sudden, especially with all the crazy things happening in this world right now. So, I I think that this is a very very unique time where you're seeing things drag out as long as possible so that rich people can make as much money as possible to keep baiting and baiting and baiting and getting people to short this thing to make it short squeeze even higher using that liquidity to keep it pumping higher.
But overall, this is going to end very abruptly and you will see a big pullback that people will call a stock market crash and then we will end up turning up into 2026 and 2026 to 2027. whole year of 2026 is where we are going to watch very carefully because this is when we get into after the next weekly pullback and the next weekly upward move.
That's when we start to get in real danger of seeing a major crash. So I just wanted you to be aware of that. So volatility is still holding all the signals on the MACD, all the signals on the RSI. The 2-hour is confirming and unconfirming today divergence. But if this thing flips back up tomorrow, I am very confident in saying that this is going to be a potential stock market top.
And then I will just have to have my plan for if it goes wrong. And that's perfectly fine because that's just trading like water, folks. Anyway, if you wanted the main takeaway for today, the main takeaway that I wanted to suggest for us all today was just a prayer. I really wanted to just um ask ask the Lord to help us in this time where so many bad things are happening and we can see just evil around every single corner just happening to all kinds of people.
one. So Lord, please help us in making the decisions in everyday life that we don't let hate come into our hearts, but evil come into our hearts. But please let us do everything good and bring those who have not read your word to your word so they can see how Christ has died for them and died for their sins so that they may enter into your light and be a light for others around them.
gravitate towards them and give them peace in such a scary, hateful time. Lord, please help all the families that are struggling right now with lost loved ones. Help us not let anger enter our hearts at this time, but instead grasp those around us and focus on what's important, which is the love for each other.
Lord, I thank you for everything you've given me, and I hope to be helpful in these videos for these people so that they may better the lives of those around them. Please, Lord, help the people who do make money off of the stock market to use it for good, to help those in need around them, to help their family members, or to help themselves have a better life, but a life that brings them closer to you.
I ask all this in Jesus name. Amen. Thank you guys so much for joining me today and I hope you guys have a blessed weekend. Peace out.



Comments 0