
저자: Mr.Lucas · 외국인
요약 보기
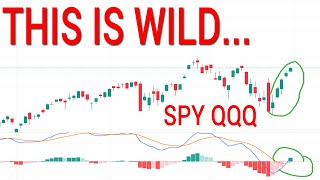
S&P500/나스닥(QQQ) 기술적 분석 영상. 월간 기대변동폭 상단에 도달해 단기 과열 상태로 보며, 금리 결정 및 연방정부 셧다운·중국 무역 리스크를 언급. 변동성(VIX) 2시간봉의 소폭 다이버전스 하나 외에는 확정 신호가 없어 당장의 고점 확정은 아니라고 봄. 이후 조정(함정 시나리오)과 1504 부근 테스트 가능성을 제시.
다듬은 글
Sorry to blind you on this very white screen as we pull up the data first off, but today we need to get into some of that technical analysis just for the spy, the cues, and volatility for today. I'm trying to set aside some more time in the afternoon, but I'm running into some roadblocks. That being said, we have the Fed interest rate decision tomorrow.
We do have the Fed press conference, so it will be very interesting. And this is going to be a window for some volatility. And that volatility may prove itself because we do see that the options market is starting to spread itself out with these daily expected moves. So, thank you so much for clicking on my video.
And let's get into what we're really paying attention to because nothing here has changed, right? Nothing really has changed. We overall were suggesting that the 2-hour confirming to the upside meant we were going to go to new all-time highs and very likely to go to that monthly expected move. And as we go to that monthly expected move, we're seeing if we do create that divergence point on the daily scale.
So, we are watching this area right here by this yellow line very very carefully. Um, if you know these monthly expected moves, what do they mean? Right, we're there. The Q's especially, let's flash over there for a second. The Q's especially are above it. What do I like to say? Especially over on Patreon.
Usually, I remind you of this. I did not remind you today, but usually we do treat this area for the month as what? It's a decision-making area. And for the week, you're there as well with our purple line. So, we do see that we are at a point where we have to make a decision. People are getting overzealous to the upside and maybe this needs to digest if you think it's going to continue.
Maybe it needs to pull back and then continue or maybe we need to set up some kind of reversal signal to say, hey, we've run oursel into a top. As of right now, uh a little blip in the spy here for a second, but as of right now, we have no no confirmation suggesting that this is a top right now. There is only one actually I kind of misspoke there.
There is one volatility signal that is suggesting that it is a possibility that today was a top. It does not mean it's the highest probability. The higher probable thing is going to be that we are going to continue these moves. So let's get into some of that technical analysis here. Let's really pay attention.
We got two gaps below to settle. We do have an event going on tomorrow. We have heightened implied volatility. That's why the daily expected moves have spread out. We are at the topside monthly expected move. So the goal for big money for the month has been reached. We're at that upside expected move.
So we do see 69261 to the upside, 68151 to the downside. And as it stands, you're outside of the weekly expected move. This is a 68% zone, meaning more the majority of the time. 68% of the time you will close within these. So we do notice that we're outside of it. And what happens right away? We finally get some kind of red bar.
We finally see that the 30 minute is attempting to close below its 9 on the 30 minute just like we did over here. Are gap ups impossible? No. Is this the pullback we're looking for to curl up to join this market? No. Right. We were looking for the pullback still. And what you would watch here on the 30 minute is you would pay attention to the daily expected move.
You would see if that 30 minute can curl down to that center line. See if it confirms to the upside again. see if it comes in the middle of this gap, test that fiveday moving average and then you can curl to the upside maybe to go tag that monthly expected move right in here at that 69053. Now that would be very very interesting but we have head up for a while that if we see something a little bit surprising right maybe we are down in these levels and drone pal gives a little bit of a surprise we could see a bigger retracement down here we could see like a fill of this gap towards 677 but overall it's just hey if the 2-hour curls down by the center line it's very likely to continue the move now this could time out to something we're talking about over with volatility volatility is suggest gesting that if you get a downward move here and then you get an upward move and you do that into Friday, you can set up a top.
Now, that could be a reversal signal we're going to pay attention to. That would be the triple divergence on volatility that I overall was mentioning. So, as of right now, I'm looking for that second move to go to that monthly expected move. This is very likely uh way more probable than just calling this a top right now.
In order to call this a top, you don't want to do it, especially when the market's going nuts and then you see a down day like this and you go, "Yeah, the market's top." And then it just curls up into positive territory again. What you want to do here is understand that a top is possible, but it's not very probable.
You do not see any indication of that on the 2-hour MACD. You do you just don't see it. So, I'm I'm sorry to say it for you people who do want a big correction. I think a big correction is coming. I think we are going to set up some kind of two-hour divergence going on into early next week or into Friday.
So, I will be paying attention to these things very carefully and posting things to Patreon when we see them. But you have a big event tomorrow. Look for that implied volatility. The next opportunity to join in on this market most likely would be a 2hour pullback at this point. The 30 minute looking a little bit wonky.
As we look at the Q's definitely at that decision-making area. Can we admit that for the Q's they are overbought way up there on the MACD they are outside of the monthly and the weekly expected move that means you have both of the 68%s are saying go down go down the higher percentage thing is they will go to the downside by Friday close that being said we'll have to see what takes place here what we're looking for is some kind of reversal signal you would have to make a lower high right that is possible for this buy if we see lower highs but for now this is so high up that you would say continuation is very likely.
I mean, the amount of times that you're up in this area, right, and you continue the move, right, even lower than that, and you still continue the move, and you get lower than that, you continue the move for these little curl-ups. Uh, it's very likely that you're going to continue the move in some fashion.
But we will look for something interesting from the Q's because the Q's are known to make a lower high while the SPY makes a higher one at major tops. So, we'll be watching for that over the next few trading sessions. 64094 to the upside. That would be 624.90 to the downside for your daily expected move.
So, this is your 68% zone for tomorrow. We'll see if we get any surprises. As of right now, the 30-inut chart is what you want to be watching for that. It is suggesting like, hey, this thing's been up there for a while. It doesn't even have divergence or anything on your RSI, but it is starting to give the inclination that it wants to reject.
But what we would still look for here is this is an extremely bullish move that if it came down and tested that five and just curled back up into positive territory, you are very likely to test this high, but you're also very likely to go make a new one. The bullishness does not look like it is ending.
We would need to see some kind of 30-inut divergence or at least some kind of lower high from the 30-inut to convince us that this thing is over. Um, and that would actually more likely have to be seen on the 2-hour chart. That being said, for the bears out there, volatility, okay, volatility as of right now is the only thing that is suggesting that today could be a potential top.
I'm not willing to say that. I do not. And Wow, look at that CPC come out. Look at the top right.57. You don't think people are overly bullish right now? Well, that that's the that's the put call ratio, my friends. And it just posted a 0.57. That is pretty wild. So, what are people doing? They are ignoring the risk.
There is a lot of risk with the with the um with the government shutdown. There's a lot of risk with the government shutdown. There's a lot of risk to companies with that government shutdown with the whole snap thing. I'm not trying to get political in this. I don't I don't care which way you lean. Um I really don't.
I just know that a lot of these companies did lobby and this is kind of a bad thing in politics. I don't agree with it that these companies will pay their employees less. Like Walmart, you guys know it's not my favorite company. Walmart will pay them less money and then give them food stamps that they then can do what they then can only spend at Walmart.
So these type of things can affect companies these type of government shutdowns where they do things where they shut down funding. So this is going to be a big deal and a lot of people I think are ignoring that risk. Also, we have the potential for the China deal to come through. We have the China deal that could see some wonkiness.
It seems like we always see some wonkiness with China. So, I just wanted to put some of that little bits out there. And then look at the 2hour chart from volatility. The only thing that is suggesting that today is a top is a tiny little divergence right here on your MACD. That is it. There is no other signal out there.
There is nothing on the spy. There is nothing on the cues. You know, if you sit there and you say, "But there's daily divergence." The MACD is curled up. The MACD is curled up. If you if you take into consideration and people are telling you that this is a divergence point, and you're seeing them post pictures and they're not analyzing further, they're just posting a picture like this.
Be very careful with that kind of analysis. This is curled up in positive territory with room to go up. You have not seen the weakness and momentum here. you have not seen this curl back down to confirm that divergence. So, do not call this divergence until it confirms. This is a huge tip for you guys out there that are still trying to learn about divergence.
Make sure that you know that this right now is bullish. Even if the breadth is bad, even if everything's crap out there, that is a bullish thing. You need to see weakness in the shorter time frames to call it some kind of trap right now. and I'll tell you what kind of trap I think it will be at the end of this video.
I will walk you through trap number one and I will walk you through trap number two to end off the video because it was already mentioned just in a different format. So, back to volatility. We do see that this is the only thing this is the only thing that is suggesting that the daily MACD can curl up into positive territory.
You guys know my standpoint. I think that these things work better when they're at the same time. And it's not I think it, it's I know it because I have done it for a very long time. So I know that we probably want to get down to that 1504. 1504 is a critical level that I've marked off for years now.
I highly suggest these white lines. You do put them on your chart. They will give you some navigation on, hey, where's a general area where I can look for some reactions. What did I say was going to take place here? Well, I said we were going to come down. We have the divergence point. Let's confirm that to the upside.
Start to pull back. I wanted that pullback to start today, but now it's going to go into tomorrow and then we'll see if we can create a triple divergence on the MACD and create that single divergence here on the um RSI. Okay, that's what I want to see here. That means that we need to see a little bit bigger of a pop and get up to these type of areas.
Then we need to curl down to 1504. Then on Friday, we potentially can turn to the upside and set that Friday trap. If this confirms, you will see me posting pictures. If it is about to confirm, I most likely will post pictures of this to Patreon. Why? Because I like to post it before it confirms. You guys know what a confirmation looks like.
You guys are the ones controlling your money. You guys are the ones clicking the buttons on your screens. So, make sure that you're taking into consideration, hey, do I want to get in before this confirmation, after this confirmation, blah blah blah. Do your strategies, have your reasons, and have a plan for if it goes wrong.
But this is what I'm looking for. This is way way way this if this shapes up here and this shapes up right here and this goes and tags 1504 we see that divergence point you will have one of the biggest hints for one of the best reversal signals for volatility that you can see 2-hour divergence 2-hour divergence on both the MACD and RSI this does not have to show up with the spy it can trick people out momentum could look okay and then completely die off so what I'm looking for here is triple divergence for the MACD and the RSI at the same time.
Single divergence on the RSI. That would mean that we're going to go down and test 1504. Why would divergence be something I'm paying attention to on Friday? Well, because that would be enough to do what? Keep the MACD right near this center line for a couple of days and then curl up into positive territory.
What happened the last time that we saw a move go positive for volatility? curl down to the uh curl down to around 1683. Another one of my points a little bit less aggressive here, but here you go. Turns down to but curls up into positive territory. What happens? Big volatility swing. Major volatility swing.
And when I say a major volatility swing, I mean you could get a few weeks that look like this bar right here. You get a few weeks like that. So that is going to be a massive massive deal. Okay, so for today I just wanted to get into a few of those things. I will go through really quickly trap number one and what I think will happen over the next few sessions.
Just know that this is the I think part of the video. This is where I think comes to play. You need to make sure the market is proving everything that's going on here. But this would mean that tomorrow we actually do see some kind of dip down, maybe an overreaction. I think that we get this 2 hour by that center line and then we get some kind of lower high or some kind of divergence point and it could be very fast.
I'm talking we could go down to this daily move. We could see this blip down blip back up and make a reversal signal in the next like two trading sessions on this on the uh 2-hour chart for the spy. That would be very very interesting. But this right now to me looks like the formation of trap number one.
And then we would go down. We would set a bear trap down here. So one would be a bull trap. Two would be a bear trap. Three would be the next bull trap. And four, well, that's actually four. Four is four is the third bear trap coming to fruition. And we end up taking out critical levels. The critical level for now to take out is actually right in here.
Obviously, a lot of people are going to be pointing to this 653. Uh once you get past 65321 is where we will start to look for a potential bounce and we will update you with monthly expected moves for November. I did go a little bit longer than I I wanted to. My wife's upstairs probably tapping her feet about to throw a shoe at me because she's Spanish.
But but I hope you guys appreciate that. I'm trying to take the time out of my day to come in here and update you because I do like helping people out. I hope that, you know, retail can really learn from this information. Retail can know, hey, at least maybe take this away. You're at the top side of a monthly expected move.
You have a 68% chance to close below that line. So going long for the next week is a little bit of a difficult decision to make, but you can make that decision because you're in control of your money. So as of right now, trap number one, I think, is already potentially here. I think we're going to head into a bear trap to go set trap number two, and then I think this market might be over, but that is all dependent on does volatility make the reversal signals that Mr.
Lucas over here at the money-making market wants to uh wants to shape up for us. All right, so thank you guys so much. I hope you guys have a great rest of your day and I hope you have a great night and look out for volatility and Patreon members, look out for some posts over the next couple trading sessions if you start to see volatility in the market shape up some things that we're talking about in this video. Peace out, guys.



Comments 0