저자: JustinCaron · 외국인
요약 보기
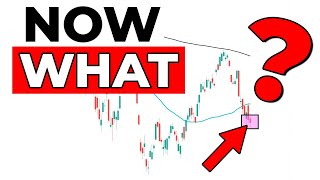
S&P500이 Powell 발언 이후 헤드앤숄더 패턴을 형성하며 반등 때마다 매도 압력을 받고 있다. 주간 차트가 붕괴되어 약세장이 우세하며, 390 하회 시 380~384, 이후 350 이하까지 하락 가능성을 제시한다. 비트코인, 이더리움, 주요 기술주(애플, 마이크로소프트, 구글, 아마존, 엔비디아)가 50일선 아래로 밀렸고, 미국채 10년물·2년물 금리 상승과 강달러가 주식 약세를 뒷받침한다고 본다. 테슬라만 상대적으로 버티는 모습이다.
다듬은 글
hello youtube we need to talk because there is a pattern setting up here as we are hovering around at the relative lows with elevated volume and cell in may and go away and come back on labor day in full force what i'm noticing is that ever since jerome powell spoke we have a head and shoulders and every time we get a a rip uh it's for selling every rip is for selling bounce off the 50 sell it reject off of the 50 sell it and what's so important about this is that this is very reminiscent of what what was happening between uh i don't know uh the beginning parts of january to may where we saw that there were inflows coming in and then all of a sudden we were not able to make it over the relative lows which is actually where we went down to our yearly low in june so when people started selling stocks that led to the nastiest month of the year remembering that uh we normally see eight percent decline in august and september so this is kind of like what normally happens and when we look here we have to ask ourselves are these bears going to take us even lower back down to roughly 380 or are we starting keyboard being starting to see some warning signs that maybe there is more downside or upside so today what i want to walk through is an update on all the short positioning where we know that right now we note that if reps are for selling and uh there is a massive short on it means that they don't want to let go they want to keep holding on and we went over that on the weekend video so the next thing to talk about here is the bull versus bear case well as of right now um as i'm trying to understand what the market is telling me because as a rule of thumb i like looking at the tuesday open because on tuesday we see how the weekly chart is starting to set up and as of right now this weekly chart does not look good it is no bueno and that matters because uh we got the big boys back at their desks they are trading and if we're gonna get a nasty cut we're gonna recognize some of those warning signs on other charts so when we look here this is the why bowler bear for the spy or the american stock index but there's some massive problems happening around the world the bear case here is pretty bad um tomorrow we're gonna be getting uh what do we have tomorrow german gdp so i don't know is this a buy or sell it's tough to know um but as i mentioned i'm usually looking towards uh tuesday to know what we're gonna look at here the weekly chart is already broken which means that yeah the bears are in control and as long as we remain below 390.04 which was last week's low we now have a lower high in a lower low which means that at least initially we opened flat tried to push up and then sold off so the onus is on the bulls to prove to us that we are bullish otherwise where are we likely going to go well um if you were looking at the support and resistance levels they're right here and one of them said one of them is a pivot it's this pink line that's currently at 389.75 that goes all the way back here to the low that we established on june 6th i'm looking at this gap right here on the weekly and if we're re-entering the gap and this is the pivot and we don't break back above 394 which is already our high of the week so 394 uh goes back here to our relative high going all the way back to april that's a long time ago april 2021 to be precise that's almost a year and a half ago now so if we've already kissed the level that we don't want to at 394 and now we find ourselves down here at 390 and we don't change the trend on the daily we're likely going to go down to either 384 or down to 380.5 and those two areas basically come from the high that we established after our weekly gap down and also our relative low on the monthly here at about 380.5 so this this chart here also tells us that hey bears uh you're winning and the bulls they need to show up because uh decreasing price increasing volume that is bearish it's classic bearish we stopped going up which means that our uptrend is no longer valid as of right now can end up being a trap but our downtrend absolutely valid why it's holding and we got a long ways to go before we're gonna break that that's at 420 right now so as long as a trend holds we have to assume that objects and motion tend to stay in motion which means that if we're now down here at about 390 it means we are now past center field and we are now actually entering a bear territory so the next natural target for me would be here at about 3.85 we've already lost 390.
so if we cannot hold that level which we'll look back here on the daily it's going to be really really really important because we can push down 10 more points from where we are right here it's also important to note that vix at about 25 if not higher is implying a roughly 1.5 daily move 1.25 so what what did s p do on the daily today that's right it moved about 1.3 1.5 percent yeah we moved about 1.4 1.5 percent here so vixx at uh above 25 just means that volatility here is is here to stay and i think if you're looking at the charts you're like yup volatility's back and volatility can happen to the downside but also to the upside so now that we understand where we're coming from and i explained myself in depth on the weekend so i'm not going to not going to beat that drum anymore we know 350 would be the next stop if we don't have any bullish reversal so now that the beer case is stronger and we know the levels what do we need to see from these bulls to get a reversal well um i don't know what's going to happen with this german gdp number i think that it's very dark right now the market is a future discount mechanism it's discounting that not only is this year but next year gonna be very dark in europe all right we got a new leadership uh new pm in uh in the uk but i think things are pretty bleak all around the world right now and there's also rhetoric ramping up with uh with russia i don't want to get into uh the details but it does not look good um that's just what i'm seeing and when i look to the tape i'll just visually scan across here and i'll tell you what i am trying to do because i need to decipher what the market is telling me to make a strategy to trade and as of right now um i don't see anything investable and by closing at the low of the week last week and doing what we are now lower high lower low tells me that objects in motion tend to stay in motion we're probably gonna go lower and if we look here to uh back to our daily chart what does that mean well um it's pretty simple actually so if we're currently pointing down with a double downtrend first one here found with just the blue line second one here which is found also the blue line if all we do is keep rocking that downtrend uh we would have to currently get above about 397 to break that it would be easy to say that we are again reversing at least for the most acute downtrend or the sharpest one if we can reclaim the 50-day moving average that is also roughly our weekly high so if we go back to our notes here and we look at what it would take for us to actually break bowl we have to get the 406.
it's a lot easier for us to cut down to 380 than it is for us to go back up 16 points right now but um it is generally darkest before it's done and like i mentioned right now it's pretty dark um i think that uh everyone's pretty pessimistic on what is going to happen in the next few months and uh global economies are kind of showing that look at risk assets here so uh bitcoin green to red pretty hard same thing with ether and when i look at my levels uh it's just doing what i would expect even oil is down like what's green today oh my god no dxy over 110 new 52 week high vix uh not at a 52 week high but it's elevated here it's in the it's only in the mid 20s though that's over 30s where we start getting elevated so yeah it's up but it's not like oh my god there's the end of the world happening we look at the two-year note whoa okay uh not a 52-week high but if we hold this area it's 3.5 that's a big round number the market is doing the work for the fed right now yeah the bond market in the stock market so 3.5 yeah we don't have to go a lot higher this would be a record weekly close we're also here over our high that we established in june which was what our low of the year so bond markets already saying hey i'm making a higher high what should spy be doing making a lower low that's what it should be doing if the bond market is leading and the stock market goes next what is it saying time go down for stonks time go down 362 if not lower oh no is the story unanimous let's look at the tenure note oh no yep that's right in june 13th we set our high four the ten-year note which was at 3.497 percent we're getting pretty close to it this is the highest level we've been on a weekly basis ever since we formed that all-time high sorry the 52-week high not the all-time high and that corresponded with the low of the year oh no an inversion's going down which just means that yeah longer for a higher for longer that's what the market's telling you higher for longer the 10-year note is going up more than the two-year note oh no that's right oh no and now if we look at uh a few more asset classes so we go over here to bitcoin look at that beautiful daily candle right oh no um it's sucking up all this liquidity we found over here and uh there's no meaningful green bars which means every rep is for selling all right looking at the next one ether all right so rejected off the 50 dma i was looking at about 1700 as a relative high and that's pretty much what i rejected it's now reversed about 10 whoa yep um apple apple has now got two daily closes below the 50 dma which usually leads to what continuation to the downside more evidence for the bears oops let's move here to microsoft well below the 50 dma for multiple days all right cool google yep it's in the club amazon first day below oh no right it saved it here uh sorry it closed below by about 20 24 cents it's not a lot but it's below two more days there's more momentum to the downside the only one the only other one that's holding up here is tesla tesla's actually green on the day i think it got an upgrade today so increasing price increasing volume hey tesla looks like pretty good here it's like one of the only things that's actually holding up is it good enough well when the last dominoes fall that's when it really gets bad so as of right now uh one day below back above nvidia multiple days below fail right it's below so now every major stock or etf is confirming the move what is also confirming it oil red gold red uh fdax this is this is one thing that's a little curious here i don't know why it's green does this mean that if the global recession which is supposed to be focused in europe specifically germany what do we have ah we got greenville and green price action yep is that just because of the strong dollar meaning a weak euro or is there more to play here i don't know but for us in america it doesn't really matter what we care about is whether our lines are going to go up or down and if we look at the dax up by 0.3 the dollar up by 0.6 and s p down by 0.3 what does it mean they are moving together it's just that the dollar is really hurting american stocks so spy would like like this if the dollar was not going higher but even with a rate increase in europe u.s yields are much more attractive they are higher the u.s is the powerhouse in terms of uh the economy we got another number to confirm that today ism non-manufacturing came in at 50 55 56.9 versus 55.1 good data is bad isn't that what happened oh no that's right oh no even gold it's not doing as bad i can still reverse its whole move but it's got higher lows and higher highs so it's a hedge but bitcoin's telling us a story too every trillion dollar company down put call ratios are roughly even and what else is green today well we got health care okay and then we got utilities that's about it everything else is red so the theme is red the bears are flexing and uh i think the last thing we just have to look for is i think i forgot to mention this the only thing i'm looking for now is uh whether or not we're able to make progress here towards our um our daily gaps because this is the this is the area where the big short was put on and uh we have to pay attention to it so for spy uh if we fall back if we form a daily lower low tomorrow and we close below 390.
oh boy we're probably going to 380 in a hurry if we can hold up then we're digesting these daily lows which is when we had peak fear and we have to have to have to reverse there were so many puts today that all got paid i'm talking hundreds of thousands the video's already long enough we don't need to look at more evidence to tell us that the charts are bearish their charts are telling us they're bearish so let's listen to the evidence let's prepare a strategy and let's make sure that we're able to form at least a daily inside bar if not a higher high and a higher low on the daily before we confirm we're going to be going back up until then uh we have we cannot close below 390 period and we can also not print a daily lower low versus today which means that otherwise the objects in motion are staying in motion and we're very very likely going to coil up here into what the end of september that is where we find our bare apex at 380 meaning are we going to get another monthly cell going into october meaning is the deep dark winter here or are we now seeing light at the end of the tunnel with that said i thank you very much for watching and i really enjoy when you smash a thumbs up even destroy it and drop me a comment we try to read every single one and help support our channel to tell youtube go tell more people about stocks today thank you


Comments 0