저자: 미상 · 외국인
요약 보기
S&P500은 436~439 저항 근처에서 횡보 중이며 단기 저점 높이(lower high) 형성 후 소폭 하락을 예상. 나스닥100은 367 저항에서 저점 높이 가능성, 다우는 336~343 박스권, 러셀2000은 185 저항 돌파 여부 주시, 비트코인은 30500 저항 부근 등락 중이며 29800 눌림을 매수 기회로 봄. 특정 종목(엔비디아, 테슬라, 애플, 아마존, 마이크로소프트)에 대한 기술적 레벨도 제시하나 모두 조건부 시나리오로 제시됨.
다듬은 글
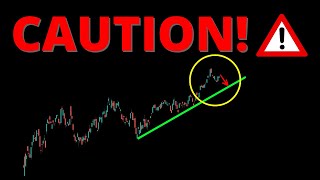
it's time to be cautious and there is no time to waste flat went absolutely nowhere and we are still closing just below that resistance right around 436 and tonight I'm going to do a little bit of prediction I do think we are going to put in a lower high from this pullback and I do think we are going a little bit lower in this market and on spy that is going to be right around 427 or the breakout right around 4 30 and then from there because we are in this bull Trend I think there's a very good chance we continue higher now the reason I want to give this prediction is because I want you to be cautious and if I show you this scenario and I highlight this scenario you are going to take it a little more seriously than if I just tell you anything is possible and follow the price action because a lot of you still have no idea how to do that and that's completely fine everybody's on their different journey and everybody is still learning how to trade but as a price action Trader you are instantly going to know if I am wrong if we start closing above the these levels at 436 to 439 so those are the lines in the sand for this scenario to play out if we start seeing price action breaking through those levels I am simply wrong and that's completely fine because it's very little risk to assume this is going to happen and I'm not even telling you to short the market I'm just telling you to expect further pullback so whether or not you short the market or you simply just sit in cash waiting for lower prices you are going to be using this critical resistance between 436 and 439 and only you can Define how you want to trade and how you want to manage risk so this is my preferred scenario that doesn't mean I'm correct and remember the market couldn't care less what I think but I'm going to give you my opinion anyway because why the hell am I here if I don't give you my opinion so we're looking at 436 to 439 and if we break that we're obviously going back up to retest the highs just above 442.
the reason I prefer this scenario is because I still think this is a bull trap balance to a lower high and I think this Market needs to put more fear into people because people are just getting too complacent and too greedy and people are really just starting to get complacent and that's usually when the mark Market is about to punch you right in the teeth so whether you're bearish or bullish I don't really care I think we're going a little bit lower before we go any higher so watch those critical levels and the critical support will be that zone between 427 and 4 30 and obviously if we break that support then we're looking for a full-blown correction that could take us to lower prices and my lowest price I think we're going to is down there at 414.
again all of these scenarios are possible and of course there's this scenario where we don't even put the lower high and we just start blasting higher I just don't prefer that scenario and it's very little risk to assume a lower high right here because we're already butting up against resistance so I am personally telling you to be cautious and expect a lower high whether or not you heed my warning is completely up to you jumping over to the NASDAQ 100 to Ripple cues we were up 0.2 percent today and as you can see we also came near resistance which is right around 367 and we did get some selling before the candle closed and this is actually a pretty bearish candle because we couldn't hold on to the gains so if you think about a bullish scenario where we bounce off support we should just go skyrocketing higher and blast off to higher highs and as you can see from today's candle we are getting a little bit of hesitation as we approach that resistance at 367 so I am officially calling this a lower high and I think there's a good chance for going down towards 355 to 347.
now again you're instantly going to know that I am wrong and that is completely fine to be wrong as long as you're taking very little risk on your idea and the very little risk on this idea is at that critical resistance right around 367. you can give it a little more wiggle room up to about 368 but again if we start closing above that level I'm wrong and we're likely not getting this scenario so you know exactly where to manage risk from remember this is a game of odds and this is a game of Risk Management so as long as you're not taking on a crazy amount of risk and you have a decent amount of reward when you're correct you don't even need to win 50 of your trades to be profitable so watch that critical resistance Zone we'll call it 367 to 368 if we start closing above it on wrong and we're likely going higher again towards 372 to 390.
again this is my preferred scenario but the market couldn't care less what I think so just because I think this is going to happen obviously does not mean that it will critical support is that retest of the breakout 355 and 347 and if we get something worse we're looking for The Gap fill around the middle of July which is going to take us down towards 333 to 337 and again that would take us a couple of weeks to get there but that is going to be a very painful decline if you don't think it's possible and you're not at least preparing for it jumping over to the Dow Jones we were down 0.18 today and we are sitting right on top of this bunched up Confluence of moving averages which is the zone right around 338 so above or below 338 is going to tell you everything you need to know but the critical support is still down here at 336.
the lower high situation in the Dow could take us up to about 341 to 343 and then if we start to get that rejection we're going to be looking for the break of critical support at 336 to tell us that we're going to lower prices but again the Dow Jones really hasn't gotten much of anywhere this year and this industry is really just going sideways so I'm not putting 2 too much weight on where the Dow goes so I wouldn't be surprised even if we're getting a big Tech correction if the Dow Jones just kind of lazily chops around between this range of 336 to 343.
on the Russell 2000 iwm ETF we were at 0.49 today and the Russell is bouncing off that critical support right into what I consider critical resistance which was the breakdown below 185. so in this scenario where the small caps are going lower we should see a rejection from 185 and then come back down towards this gap for that 176 and again these are all of my preferred scenarios that does not guarantee they're going to happen you're instantly going to know I'm wrong if we break through 185 and then we'll be looking for a retest of the highs at 188 and then above 188 we're back on the bull to 195.
so again you have the critical levels and all you need to do now is follow price action and don't just assume I'm going to be correct if we start breaking these critical resistance zones you need to assume I'm wrong and we're going to higher prices on the arcade ETF we're up about two percent today sitting right at critical resistance right around 44.5 and if we break that we're likely going up towards 46.
a rejection from here could be a double top but we'll need the brake support at 43 and then down here just below 42 and then we'll likely go to lower prices and yes it is possible because we do have outstanding gaps to the downside however we have that bull Trend so you can stay bullish as long as we're about 42 to 41 and then if we break that you're looking for a double top rejection to lower prices on the Vex we were down 2.11 today and the vix is still crushing so we still have this very complacent low fear environment which is exactly what you are going to see in a bull market so this doesn't mean we need to get bearish as long as the vix is staying below 15.
if we see the vix bike at above 15 I think we're going straight to 18 and that is going to be a very panicked sell-off but again we need to see it and we can't just assume it's going to happen on bitcoin we're currently down about two percent and Bitcoin is chopping around exactly where we would expect which is that resistance right around 30 500 and if we continue lower we're looking for possible support at 29 000 and the breakout at 28 000.
just like any bull Trend it is completely normal and healthy to get higher low pullbacks into higher highs so if Bitcoin pulls back into the breakout 29 8000 that is a buying opportunity and it is a bull Trend so we should be looking for higher prices after we Bounce from that support Zone on Amazon stock we were down 0.11 today and I don't love the daily candle rejection outside the upper boner band because if this was bullish we should have no trouble pushing to the price Target at 133 so even though we are likely going towards 133 to 134 you need to pay attention to this candle in this bearish looking rejection so what that means if we break down below the breakout at 128 we're likely going straight back down towards the support trend line right around 123 Or the critical support at 121.
so manager risk right there at the breakout at 128 and you could only stay bullish in my opinion while we are above that breakout level on Microsoft stock we're at 0.38 today holding on to the support at the rising moving averages which is 334 but if we break 334 I am looking for lower prices at 323.
If We Hold above 334 and break out we could push higher again towards 350. on Nvidia stock we were down 1.81 today getting rejected below a negatively sloping five EMA but sitting right on top of Rising 20 daily moving average at 406. on Nvidia I consider critical support 398 to 406 and if we break that we could see a waterfall wave of selling back down towards 374 so there is a lot of downside risk if we break down below support if we hold support at 406 in Balance we're going back to 427 and above 427 we start climbing towards 448.
on Tesla stock we're up 2.41 and I think Tesla is going to bounce off this Rising 20 daily moving average and get rejected between 262 to 268 and then come back down towards a support Zone at the breakout right around 2 30 to 2 15. I have a very good feeling this is what's going to happen but that doesn't guarantee I'm correct so manage your risk right around that breakout at 268 and if we start breaking 268 we're likely going straight higher towards my next price Target at 295.
so again I have opinions on where I think we're going but that doesn't guarantee I'm going to be correct so just because I'm saying this is going to happen obviously does not guarantee it will so manage a risk at that critical resistance at 268. on Apple stock we were up 0.63 percent today and apple had a direct hit on my price Target which was right there at 190 and this is one of the reasons I think you need to be a little cautious is because apple is now reaching the price Target and this is a market moving name so if Apple starts to pull back even if it's only towards support right around 182 this is still going to put a lot of downward pressure on the indices this is a market moving name and this is a behemoth that moves the entire stock market so look for a potential rejection around that price Target at 190 and the critical support remains 185 and 182.
on the financial sector we were down 0.24 today and financials are very simple we are cautious and looking for lower prices until we start closing above the 200 daily moving average which is still sitting up there at 33.6 do not over complicate it it is really going to be that simple the Industrials are flat on the day going absolutely nowhere but still in a bull Trend so you can still stay bullish as long as we're trading above 103.
the healthcare sector was down 0.32 today is testing that breakout right around 130 to 131 and as long as we bounce here all is still well and we can still at the price circuits at 134 137 but if we start to break down and lose support just get a little more risk off and we are seeing an uptick in volume on the energy sector we are up about one percent sitting right at resistance just below 80 and this is still a lower high with the potential of getting rejected at the 50 EMA right around 80.5 which could still be our lower high into our Gap fill price Target at 73.
so jumping back over the S P 500 I gave you a lot of my opinions today on what I think is going to happen but you still need to let the pricey with the bull Trend that I am completely wrong and we blast right through those resistant zones I just gave but it's going to be very simple to just be patient and wait for Price action to prove it and then you can manage your risk from those support zones and still take bullish trades I would much rather you prepare for the worse and expect the best than to think we're going higher and be surprised by more downside so there is elevated risk of a lower high rejection here so be aware of it and as long as you're aware of it you should be able to properly manage your risk in the event that we see this scenario playing out so obviously nothing thing is guaranteed that the price action do all the talking and always manage a risk around the critical levels that I give you don't forget to have my own trade alert service called bang trade alerts that will send you all of your buy and sell alert directly via email and text message and only trade the etfc triple q and s triple Q I also have the stocks Channel Discord where you and if you're interested in either service you can find out more information or how to joi





Comments 0