저자: Ross Givens · 외국인
요약 보기
이 영상은 1950년 이후 중간선거가 있었던 19개 해를 분석하며, 선거 후 12개월 뒤 S&P 500 지수가 19번 모두 상승했다고 주장합니다. 평균 상승률은 약 15%이며, 중간선거 해의 4분기가 역사적으로 강했다고 설명합니다. 또한 중간선거 해 이후 12개월 동안의 평균 상승 폭은 약 35%로 제시됩니다. 정당 구도와 관련해서는 의회가 분열되었을 때 수익이 가장 좋았다는 데이터를 소개합니다. 다만 영상 후반부에는 특정 종목의 매수 사례와 유료 구독 서비스 홍보가 포함되어 있어, 이는 투자 권유 성격을 띠므로 주의해서 볼 필요가 있습니다. 과거 데이터는 미래 수익을 보장하지 않습니다.
다듬은 글
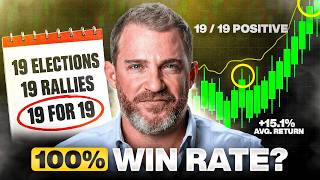
The time has come, friends. On November 3, Americans officially head to the polls for Congress, and at stake is a stock market record that most have never even heard of. There have been 19 midterm elections since 1950 , and the S&P 500 index was higher 12 months after each one. 19 out of 19. Not most of the time, but every time.
And the average market growth was about 15%, which is significantly higher than average. Democrat in the White House, Republican in the White House, wars, recessions, inflation, oil shocks—it didn't matter. 19 of 19. Today I'll show you why this is happening and what to expect in 2027. I'll also break down the political alignment that the stock market has historically liked the most , and I think it will shock you.
It's not what you think. So hit the subscribe button and I will be your daily dose of market wisdom. Now, before we get to the graphs, it's worth knowing a few statistics. While election years are typically favorable for stocks, a midterm election year is the weakest in the four-year presidential cycle.
I have analyzed the S&P since 1950, and in midterm election years the index has only finished the year up 11 out of 19 times, or 58% of the time. But this year, in 2026, there is confidence in the second half of the year . The fourth quarter we are in now is historically extremely strong. And I think the reason for this is that investors are starting to gain certainty about the election results, whether they like them or not.
After all, for months, no one knows who will control Congress. No one knows what will happen with taxes, spending , healthcare, and regulation. Every election ad convinces us that the opponent will ruin everything. And Wall Street hates uncertainty. Therefore, the money remains aside. Stocks fluctuate, volatility rises, and then finally the votes are counted.
And whether you like the result or not, the uncertainty disappears. Wall Street now knows the rules of the game for the next 2 years, and the money that was waiting is returning to the market, pushing it up. That's why, I think, the fourth quarter of the midterm election year was so strong . Since 1950, the S&P 500 has averaged a 6.6% gain in midterm election years, from late September to late December.
This three-month period that we are in now . This is the best fourth quarter in the entire 4-year cycle. In other years, the average is between 2.5 and 3.5%. It has been positive 16 times out of 19. Since 1940, it has made a profit 86% of the time, and look how significant the growth can be. This is measured from the lowest closing level of each intervening year to the highest point over the following 12 months, and the average market growth is around 35%.
Each of the 19 cases showed an increase of at least 15%. The smallest was in 1994, and the largest was in 1954, when it soared by 48%. And in 18 of those 19 years, that minimum was reached by midterm election day. So, by the time most people start paying attention to the election, the bottom has usually already been reached.
And it's really ironic, because the moment when everyone is most nervous has historically been the best time to shop. And it has always been that way. September 11, 2009 , COVID, rate increase in 2022, tariffs in March 2025. Whenever things looked their worst, that was usually the minimum. Now let's go back to the graph, because that's what I want you to remember.
This is the return of the S&P 500 from the day of the midterm elections, which this year falls on November 3, to one year later. Every midterm election since 1950. And even the worst of them, as you can see, were profitable. And look at the middle of this graph, 1962. It was the year of the Caribbean crisis.
25% growth next year. 74th year, the height of a tough "bear" market. We had the Watergate situation, a 19 % increase the following year. So often the world looks scary in many of these years, but the market still grew. Now, if you measure this, and I know I'm getting into the data, but stay with me for a minute .
If you measure from the end of October, rather than from Election Day, as Yahoo Finance did , you get the same result. 19 out of 19 cases showed an even bigger gain of 16.6%, which means: if you bought the stock today, on the last day of October, and held it for a year, the probability says that you would get a 16.5% profit over the next 12 months.
And here's something else. Seasonax, a firm that studies market seasonality, they really researched this topic in depth . And the period considered was five—I don't know why this particular period—five trading days before the midterm elections and 2 days after them . So, from last Tuesday, a few days ago, to next Thursday.
And if you look back to 1934, the S&P index rose in 22 out of 23 of those periods. So, history says that we are now in the " sweetest" place. Now, which part of the market, which sector performed best ? Well, I shared this data back in September as we prepared for the fourth quarter, pointing to the healthcare sector as one of the best .
Health care costs seem to be rising regardless of who wins. So then, on September 8th, and many of you have seen this video, I highlighted Hinge Health, ticker HNGE, in that week's trading video. I bought it here, live with you. And judging from the comments, what you guys said in the live sessions, it seems like a lot of you bought it.
If you did, congratulations. You earned 24% on this promotion in 7 weeks. And because of this breakthrough model that we entered, it performed even better than the rest of the healthcare sector and just crushed the overall market. This is why I always recommend using a top-down approach. You have a strong market, so the wind is blowing at your back.
You have a group, a sector that is either leading this market or is in a historically strong period, like healthcare in the fourth quarter. And then buy stocks when they break out of these consolidations. This is how you can significantly tilt the chances of success in your favor. And if you have no idea what I'm talking about, you need to join my Black Ops trading service.
Now it only costs five dollars. This will give you a full year of membership, with no obligation. But I will teach you these models . I will show you how to find leading groups and leading stocks. I will give you my indicator for life that shows you which areas of the market are leaders. We have weekly hour-long interactive group mentoring sessions throughout the year, and it's all included for just five dollars.
Plus you'll get my weekly newsletter and a few other bonuses. So if you're not a member, click the link, scan the code, or just go to tradewithross.com right now, sign up, and I promise it will be the best $5 you spend today. Now, someone will win. Well, let's talk about what happens on November 3rd, because this is where things start to get interesting.
Personally, I have always believed that the stock market does best when no one party controls everything. Because when one party has the White House and the other has all or part of Congress, it's simply harder to implement these big, radical changes. And Wall Street just wants to know that the rules won't be rewritten every few months.
So, I checked this out and it's true. From 1950 to 2025, the best returns were when Congress was divided. Because if one party controls the House of Representatives and the other controls the Senate, nothing gets done. Which is exactly what Wall Street wants. She wants predictability. She doesn't want tariffs, wars, and changes in healthcare that no one expected.
Unfortunately, according to bookmakers' predictions, Democrats will gain full control of Congress next week. Polymarket gives Democrats about a 92% chance of winning the House of Representatives and about a 67% chance of taking the Senate. I hope this doesn't happen. I hope each party gets their way, because all I want is for these weirdos to spend the next 2 years whining at each other for their TikToks, not spending any more of our taxes or making the economy harder.
Historically, under a Republican president, like we have now, with a Democratic Congress, which we seem to be getting, returns have been around 7% per year, which is the worst combination. But that can be misleading, because much of this result is driven by just a few truly terrible periods. The 1974 oil crisis and the 2008 financial crisis.
They had nothing to do with the political stalemate. These were " black swan" events. And if they are excluded, the results will be much better. But the fact remains: The 12 months following a midterm election have always been profitable—19 times out of 19. That record takes into account any outcome.
These are victories for Republicans, Democrats, and a divided Congress. The market grew after each of these options. You see, Wall Street doesn't need any particular party to win. She just needs the election to finally be over. And, honestly , I think we're all ready for it . Friends, don't forget to subscribe to the channel and be sure to register for the Black Ops trading service.
I guarantee it will be the best $5 you will ever spend. And if you are dissatisfied, if you feel that you did not receive a hundredfold value, let me know. Write me an email. I'll put a $5 bill in an envelope and send it directly to you. Thanks again, and see you in the next video.




Comments 0