저자: 미상 · 외국인
요약 보기
S&P500이 저항선 돌파로 숏스퀴즈 가능성이 있으며, 지수들이 상승 추세의 고점·저점 상향을 유지하고 있다고 주장. 소형주는 약하지만 시장을 좌우하지 않는다고 봄. VIX가 16 아래로 내려간 것은 공포가 사라진 강세장 신호로 해석. 비트코인은 단기 저항 거절 가능성, 장기 강세 유지. 개별주는 구글·마이크로소프트·애플 상승, 아마존 실적 후 조정이나 지지선 유지 시 상승 기대, 테슬라는 단기 반등 후 하락 가능성, 엔비디아는 박스권 돌파 방향 대기.
다듬은 글
today the stock market indices are pushing higher and breaking through some very critical resistance zones which could lead to a short squeez's spy was up 0.85 percent on a very bullish candle with no Wick below the candle and no Wick above the candle so that is one of the most bullish looking candles you can possibly get and it was on decent volume so without a doubt this is going to start being a short squeeze because we are getting that very clear breakout of what I told you was critical resistance at 414.
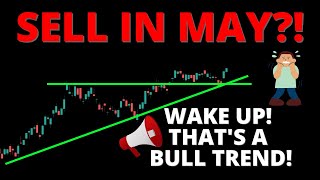
remember I spent a lot of time talking about the bullish structure of the market and why we were likely going to continue trending higher and why we were likely going to squeeze out all of the shorts before we go any lower that is exactly what's currently playing out and if you just look at the chart and you let the chart do all of the talking none of this was surprising and we actually expected this to happen if you look at spy's price from the closing highs we only came down about 2.4 percent to the rising 50 EMA of support which was also that critical support at spy 404.
anytime you're at critical support in a bull Trend there's a very good chance Bulls are going to step in and take on risk and that is exactly what happened to add fuel to the fire we had lots of short sellers stepping in expecting support to fail because they were being subjective and they didn't wait for any confirmation of the price action so we also had extra buying forces from the short squeeze remember anytime you're short selling you have to become a net buyer to exit that position which only adds fuel to the fire and that is why we had such a strong impulsive Bounce from that support now typically speaking in a bull Trend you need to remain bullish because the trend is pushing price higher and you need to be aware of that Force because if you're going against that Force you are taking the hardest possible trade and you're making trading much more difficult on yourself if we roll over and die we're going to see it in the price action and there's still so many people trying to sell fear and continue to tell you the stock market is going to crash and continue to tell you we're going into a recession and continue telling you the stock market is way too overvalued and we need to go much lower eventually you're going to wake up and you're going to realize those people have been lying to you or they're just flat out wrong and they don't realize it but by then the question is are you still going to have a trading balance so no matter what you're doing make sure you're managing risk and if you're just piling into puts or piling into triple leverage ETFs that are inversing the market you are going to be in for a rude awakening if this is the very early stages of a bull market remember that every single bull market starts on a very pessimistic Outlook because you put in Bottoms when everybody is at Max fear and everybody is expecting the market to continue to go lower is actually the very early stages of a bull market I'm not telling you this is a bull market the chart is telling us this is a bull market and we're simply just following what the chart is telling us so we need to see lower highs and lower lows to break out of the bull Trend and right now we just continue to see higher lows and higher highs spy is bouncing off of the rising 50 EMA and breaking critical resistance that's by 414 if we jump over to the triple cues you can see that we bounce off of the critical support which was the retest of the breakout if you go all the way back to the February 2nd high that is exactly where we had the breakout we came back to that level tested it as support and had a very impulsive Bounce from that support on very decent volume so again the spy and the triple cues are telling us we're making higher lows and higher highs and if we jump over to the Dow Jones we're also getting a bullish breakout from the retest of critical support between 332 and 334 and today we had the higher high breakout above 340.
so all three of the major indices are showing a breakout retest and a confirmation of a balance and price action and Trend are continuing to tell us this is a bull Trend which tells us we're going higher does that mean we'll go higher each and every day of course it doesn't it is always going to be pullbacks within a bull Trend but those pullbacks are buying opportunities and you shouldn't be losing your mind screaming for a crash ever every time the market has a pullback if you're one of those chicken littles that thinks the sky is following and you can't manage risk because you're just so scared the Market's going to crash trading is not for you and you should look into a different strategy there's always going to be emotions in trading because money is involved but you need to learn to listen to the price action in the trend and they are still bullish so there is no reason you should be subjectively bearish until the chart tells us to be you can go back to all of my videos from 2022 and we were bearish for a lot of the year and I even had a picture of a bear on the chart telling you exactly where the bear was likely going to show up and each and every time we reach those levels the market reversed and continued to go lower all we were doing last year was following the trend and all we're doing this year is following the trend there is nothing subjective about it we are strictly letting the chart do all the talking so jumping back over to spy and spending a lot of time going over this because a lot of you really need to hear this because there's still so many people out there trying to sell you fear and trying to scare you shitless that the Market's going to crash so that you don't actually join in on the rally so all you need to do on spy is simply manage your risk at support and continue to stay with the direction of the trend right now that is very simply done at spy levels of 414 and 411 and it does not get any simpler than that while spy is above those critical support levels we're likely going higher with the next upside targets at 417 and then 421 do not over complicate it spy is either above or below support and still in the bull Trend or it's not manage a risk right there at support so if we start to break down below support you can instantly reduce your risk and that way you don't lose too much money if the market starts to reverse yes I know we have gaps to the downside and yes I know those gaps are eventually going to get filled but we don't know when it could be a year from now it could be next month nobody knows for sure so all we know what to do is read what the chart is telling us and follow what the chart is telling us and right now the chart is telling us we're going higher on the NASDAQ 100 triple cues we were up 0.69 today in the triple cues due did close that Gap at 322 so we can go ahead and delete that Gap fill and clean up the chart and we can see we did get the bull breakout to the higher high above 321 after putting the higher low retests of the breakout this is a textbook bull Trend and big tech companies continue to lead the way higher and we still have that double bottom price Target up there at 327 which is likely where we're heading next does that mean we go straight there in a straight line without any pullbacks nobody knows for sure so there's always going to be pullbacks but what you need to understand is we're in a bull Trend and we're likely going higher so manage a risk at the breakout between 320 and 321 in the rising 20 daily moving average at 317.
on the Dow Jones we're up 0.84 percent today and the Dow Jones had a very bullish breakout today because we broke out to a higher high after a higher low so again this is just textbook bull market behavior and a bull Trend that's likely going higher our next upside targets could take us to 343 and then 346 and manage a risk at the breakout at 340 or the breakout down here at 337.
on the Russell 2000 iwm ETF we were up 0.88 today and as you can tell the the small caps are definitely the weakest looking sector but the small caps do not dictate the stock market and do not dictate where spy is going the small caps are a very good risk on Behavior if we do see them rallying so we would like to see them breaking out but we currently don't small caps need to break resistance at 176.
this resistance trend line around 178 and then fully close the gap and break out above 181 and then we'll be getting a lot more bullish in the small caps fill the Gap to the downside and we still have a gap to the upside so for all we know the small caps are about to go on a very impulsive rally tire prices manager risk at support down here at 170.
on The RK ATF we're at 0.62 percent today and there's just no reason to spend too much time here we know it has a triple top and it's breaking down and it's likely going to 32 and it's not bullish until we break above 40.5 on the vix we were down 7.34 today and the vix is now closing below 16 trading at 15.77 and just go back in history and look at every single bear market and tell me which bear Market the vix closed below 16.
this is exactly the type of vix we see in a bull market because there's just no fear left and everybody is just following the trend and nobody cares about buying puts because the market is trending higher so when you get a vix this low you need to be very cautious if you still think it's a bearish indication you should go do your research and go study the vix and go look at the vix in every other bear market and tell me if you still think this is a bear Market on bitcoin we're currently down about half a percent Bitcoin is trying to break out at 29 000 but you need to be very cautious here because if Bitcoin is trying to roll over and die it is likely going to get rejected right around this level at the lower high and come all the way back down towards 25 000.
I'm still bullish on bitcoin for the long term but in the short term it does look like it is going to get rejected and head back down lower however we're going to let the price action tell us and we need to see that breakdown below 27 000 or at least a high volume rejection from 29 000. on Google stock we were down 0.23 today and Google is looking like a bullish Hammer continuing into the bull Trend and we are very likely going up there to fill that Gap at 110 before we get any sort of pullback so you need to stay bullish in Google stock as long as we're trading Above This support at 104 to 105.
on Amazon stock we were down about four percent today after earnings and if you look at the chart this is very obvious why we're getting a pullback because we close way outside the upper Boulder band before earnings which told us a lot of the good news was already priced in and we were likely going to be due for a sell the news event this is not bearish this is just very simply technically sound that when you get over extended going into a big event you take your profits and you don't risk losing them so Bulls sold just like any disciplined bull should however this is not necessarily bearish as long as we bounce off support at 104.
so if you want to get bullish on Amazon this is your time to do so as long as we hold this support zone between 102 and 104. I still think Amazon's going to 115 and I think it's going to happen very quickly so do not miss this trade because as very low risk and it is very likely going to succeed on Microsoft stock we were up point eight percent today and Microsoft is just blasting higher outside the upper bowl under band and getting very close to our next price Target which is this Gap close at 310.
I think we're going to see it cool down after we hit that price Target so I'm not going to spend too much time talking about higher prices so once Microsoft hits 310 look forward to trade sideways and see a little bit of distribution and then eventually we should come back down to retest this breakout around 290.
on Nvidia stock we were up 1.92 today in Nvidia is still in our sideways trading range between 262 and 280 and above 280 we're looking for 300 and Below 262 we're looking for 242. we'll let the price action tell us which one comes first based on the breakout of the range on Tesla stock we were up 2.57 today and Tesla is getting that bounce off support at 154.
we broke above the resistance at 160 which means we're likely going to 167 and then 173 and if we break through all of that resistance look for The Gap closed just above 177. however I'm still on the camp that Tesla is still trending lower so after this lower high rejection I do think we're going down to close the app at 146.
on Apple stock we are a point seven five percent today and apple is getting that bull breakout and reached our price Target at 169 which means we only have one more price Target left which is the Gap close at 171 and I do still think we're going to get there before earnings you can see we still have the bull Trend we're still bouncing off support we're still putting higher lows and higher highs and we're very close to the price Target so I see no reason why we're not going there when you can smack it with a stick on the financials you're up 1.19 today and the financials are getting the balance from the 20 daily moving average but we're right back to resistance right around 33.3 so respect the resistance and do keep in mind we have gaps to fill to the downside so we could get one more dip before we go any higher on the Industrials we're at 0.97 today with price action back above all the moving averages and we're going to know very soon if we're going to get the bull Trend because we just need to break this resistance and get a higher high breakout above 101.
on the healthcare sector we're up 0.85 today coming right back up to resistance at 134 and I still think there's a great chance the healthcare sector is going up towards 138 to 140. on the energy sector we have 1.55 today after bouncing off of the Gap film we're getting rejected at the rising 20 daily moving average so we're going to look a lot more bullish if pricey action can break above all the moving averages I think energy is heading higher and I think we're going to see that gap for that 91 next so jumping back over the S P 500 I continue to tell you to follow the chart follow the price action and follow the trend and right now that is still bullish and we are still trending higher I know a lot of you want to debate that with me and you tell me you're buying puts and you're buying triple leveraged inverse ETFs and you want to brag about it but there's nothing to brag about when you're doing that and the market only goes higher so keep in mind I'm only trying to help you here I'm not trying to tell you what to do I'm trying to open your eyes to how important it is to follow the chart so if you're mad at me because I tell you the stock market's going to go higher and then the stock market goes higher are you really mad at me or are you just mad at your own trading so stay disciplined and follow the chart and let the price action do all of the talking you could by coming and joining the stock sends you all of your buy and sellers checklist email and text message and only traded to ET i





Comments 0