원문 보기
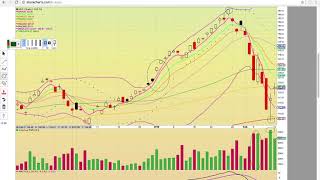
everybody this is Osprey from my trahe ETF's okay so the markets are on a two day bounce for the indices and and so we're looking at a nice nice bounce here so so with the bounce these bowl ETFs are starting to reverse most of them are still in a very strong downtrend but they are trying to break resistance right now so I'll show you where they're at on the charts and so we'll keep an eye on them if the reversal continues you know these could be in play the inverse ETFs were really strong during the the market pull backs and and you know they delivered really big gains and so you know if the markets do reverse this would be a place to check out for some potential percentage gains but but if you know the the the downtrend fail to reverse you know it's gonna be as simple the Bears are still in control so first up let's take a look at spxl okay this is the sp500 bolt three times and so what's going on is it's bouncing off of the 200-day simple moving average that's this red line down here at $38 and so the candles work back into the bands and the bullish development today was the close above the pink wine that was EMA for currently at 42 18 okay so that's the first close above that level since this you know drop started on the close below on the 30th below the pink line and so and so the big level the break is going to be this gold line the 100 a simple moving average at 40 to 60 so above 40 to 60 would be bullish and then we'll be looking for a run up here to EMA 8 at 43 98 basically $44 now if it fails again about 40 to 60 or or if it drops below 42 18 if it fails to hold that 42 support level it drops below if there's a closed below that's gonna be a major red flag signaling the the Bears are still in control and there could be a retest of the recent lows and a retest of that 38 level so keep that in mind okay so yeah so we're looking to see if it can break above resistance now take a look at nugget okay in you GT this is the the tricks on daily gold miners index Bowl three times and so this is this is heating up right now it's it's got above 30 on RSI and above 20 on on Fastow after being oversold on both levels look at the bounce on on plus di you know and you've got the end then you've got the pull back on - di you know this is a single that that you know it's bouncing notice the big drop I mean it was up here at 38 and then the big pullback you know you know you had dust was in play D UST while while this was you know dust was going up the Nugget was dropping and so it dropped all the way down notice the clothes below EMA 4 on this day on the 29th you know it didn't close above the pink line until today this is the first close above the pink line so as long as that $25 level holds it's gonna signal upside potential and we're looking at 2650 is the next level to break that EMA 8 level thinking about 26 50 then that would be a signal that the Bulls are really heating up you know if it fails to get about 26 50 that could be the signal top of the run or if it drops below 25 that'll be a major red flag the thing to keep an eye on on these ETFs is the big volume at the bottom look at the big volume spike and then the lower wick on friday's candle you know that look like loading you know like like you know traders were loading same thing here for spxl look at the long lower wick on friday's candle and then the large volume bar you know it looked like heavy loading and then now we had the follow-through today and with that with the big bounce and then now let's look at jane ugh okay so this is the jr gold miners of bowl three times and so yeah and so keep in mind that the three times you know that they're gonna be more volatile and so the the you know you could get you know that can work in your favorite to the upside but it could also work against you to the downside and so as you can see this had a really big drop from 2050 all the way down below 11:50 at the bottom and then once again notice the the volume bar on Friday for all these ETS was larger than any of the preceding volume bars and then and they formed the long lower wicks on the on the Fridays candle and so that that's a single live loading you know keep in mind the big players load at the bottom and they sell at the top and so you know it looks like there were a lot of people were trying to time the bottom on Friday and they were rewarded today with the big with the big move and so here for Jana get closed and bub EMA for at 13 27 you know for the first time since the pullback below that level basically actually this got below the level here you know before the 29th you can see that this Campbell here close below the pink line and there hadn't been a close above until this day okay until today and so that that's always the first step now if it drops below that 13 27 level that's gonna signal it's not ready to go it needs to break about 14 14 s the big level a close above 14 would signal that it wants to head higher you know notice the 8 13 and 5 is pinched you know you want to see a cross over there notice also that this is looking like a double bottom support level and so you know this is a crucial level on the charts you know it came down here formed a double bottom with December and so you know it really needs to hold the 12:25 support zone okay take a look at fast okay this is the financial Bowl three times and so yeah it had the big pullback it went from 883 up here and it pulled all the way down to 57 now you can see here with fast people were trying to time the bounce before you know it got down to the low and and you know that does happen and you know it happened with other stocks as well you know this ETF here you know once again on Friday though there was a large lower wick I mean look at the doji that formed you know this is low of day and then this is the close so what this is telling you that the and and the open was the same level as the close here on this day and so the Bears were able to drive it all the way down to 57 but the Bulls were so strong that they were able to close it all the way up at 63 and at the same level of day even though there was all this movement fast on Friday closed at the same level as it's open and this formed you know it you know a you know this is the bullish harami cross reversal pattern you know anytime you see a doji in a downtrend you know that that is a signal to keep an eye out for it bounce that's a bounce candle and then the long lower wick shows loading and so yeah so we're gonna keep an eye on it here once again it got above the EMA for the pink line if they could stay about that level and it actually did close above the 100 a simple moving average that was a big move above 64 92 so basically you want to see it stay above 65 above 65 we'll be bullish and then you're looking at the next level this EMA a at 67 54 okay let's look at EDC so so you know the United States markets have been under pressure well emerging markets have been under pressure as well and this is emerging market Bowl three times and so the this you know people were really hot and heavy on emerging markets you know it was the big thing at the start of the year you can see it ran from you know 1:30 all the way up here to this you know close to 168 level and then BAM they drove it all the way down to this 107 108 level and it hit that 200 a simple moving average and bounced right off of it you notice the long lower wick on Friday notice Friday's volume bar was larger than the preceding volume bars you know you know they were trying to time it again here that and it pulled back further I think a lot of people who were looking for the bounce you know last week off of the fifty and a hundred day simple moving averages on a lot of charts that that broke and the the the 200-day simple moving average was tested you know a lot of the support levels broke last week that that typically would have held in a normal environment you know it was unusual to have such big pullback without without any type of major correction you know anytime candles are forming below am made for resistance that's a single the Bears are in control and you want to be either short or on the sidelines until that level breaks or you're trying to tie in the bounce if your time of the bounce you're playing it back up to that level and and and then it needs to break that level and close above the Similan wants to head higher and that is what happened today for EDC but but it you know closed above EMA for for the first time since it turned into resistance back here on the 29th of January and so that you know this is looking like you know it's trying to create a bullish change in trend but unlike fast it's hitting that 100 a simple moving average at 123 and so if they can close above 123 there to 128 EMA 8 you know it has the 50-day moving average at 131 as well to break okay so check out China so China Bowl three times why and I in and okay so this is heating up as well it's it's not doing as good as emerging markets so the china bowl is not doing this good it had the big pullback from 54 all the way down to this 30 level it bounced right off the 200 a simple moving average just like the other charts that we are looking at but but you know this is still below EMA for it still has some work to do the candles worked back into the Bands after Friday's candle real candle body and the extra the entire candle for me below the lower Bollinger Band when that happens many times the candles will work back into the bands now this chart really isn't gonna heat up until it's above this thirty five sixty level above that hundred a simple moving average that would be your signal that the reversal is happening it's still you know clear that the the Bears are in control but keep an eye on it for a break above that thirty five sixty level okay take a look at la bu this is the S&P biotech Bowl three times and so you know it did close up six and a half percent today it had to pull back from this 117 level on the 29th it came down it bounced off the 200 a simple moving average and then today it did close above several key resistance levels you know this was the close on Friday at 80 the bottom of this black candle and notice the long lower wick and then you know notice Friday's volume bar was larger than all the preceding volume bars so there was heavy loading on Friday and then today there was a close above EMA for and so so it's trying to get back above that level it tried to get above that level last week a can turn that level to support and and also got above the hundred and fifty days simple moving averages so it closed above three key levels today you know now it's 88 50 and then the the EMA 13 at 91 those are the next two key levels you know so we're gonna see if it can go from 85 up here to 91 did to head back up you know it did that on the previous bounce it has to follow through here yeah we're gonna we're gonna see if you know Tuesday you know that are the markets going to follow through and have another you know Green Day three green days in a row or or is Tuesday going to be a red kind of the inverse of what happens when we had when you have a red day on Friday and Monday you know if you know you went when they're down it going into a Friday usually there's not a bounce on Monday it usually happens on Tuesday so you know you're up on a Friday you're up on a Monday you know could be a little cool down tomorrow on a Tuesday we'll see it would be really bullish if the markets are strong again tomorrow that would be a major sign the Bulls are back out in force okay let's look at te CL this is the technology ball three times closed up five and a half percent today and so you know it pulled out you know it bang if the thing stocks are gonna reverse you know and Netflix and Apple and Google and all those are doing well you know that you know the te CL will be doing well is it will be doing good as well and so here it is bouncing off of the 200 a simple moving average this is a thinly traded ETF you know it got back above EMA for for the first time you know since the pullback and then it's back above the the 100 a simple moving average so yeah keep an eye on it for a break above 115 resistance if you get above 115 120 is the next key level to break that 50 days simple moving average so yeah we'll see if that can heat up and then take a look at ER X this is the energy ball three times so yeah you know has been under big pressure this did close up 5% today our side did close back above 30 after being below Fastow's right at 20 this is still in a very strong downtrend okay so the Bears are still in full control it closed below EMA for today after at breaking intraday and it also hit that 200 a simple moving average at 28 85 and so those are two key levels to break it has to close above the the pink line and then above that red line the tuna days simply be an average to signal that that the reversal starting you can see on Friday people tried to time the bounce you have the long lower wick but but you know oil you know this is the you know energy boil you know the oil is under big pressure it has to you know you you're gonna have to see a reversal probably in oil before this really gets a good reversal going and it's below all the moving averages right now so this is you know very oversold levels and so you know think get above 28 30 and then basically 29 if you see er X about 29 that would be really bullish because he run back up there to 31 as long as candles are forming below the pink line it is a risk to hold okay look at G ASL this is the gas related ball and it did break above the three times it broke above RSI at 30 it has the same chart setup you know it's it's it's forming candles below EMA for resistance you know add the load here on Friday it has to close above EMA for 18 to get that reversal going okay so hit that level today we'll keep an eye on and see if it can break resistance and then get G USS G us H okay this is good it's the bowl three times and so yeah as you can see here it pulled down as well and then it's hitting that EMA four as well and so once it gets a close above EMA 420 83 that's gonna be your signal okay this is finally heating up and that's when we'll be talking about that 23 dollar level you know failed to get about that level and it will be a risk to hold as you can see people were trying to time the bounce here on Friday there was a big drop-off and volume today yeah yeah so keep an eye on these three times ETF's keep an eye on the you know it's an ETF sir way to play they these do many of them do trade options you can look up here at the top of the chart and it'll tell you whether or not they do trade options and that that is a way that you can get more bang for your buck if you're on the right side of the trade okay thank you very much please check us out at our chat I'll post the link below the video thank you


Comments 0