
저자: OspreyVision · 외국인
요약 보기
결론: 넷플릭스 실적 호재로 FANG 반등 기대, QQQ·아마존은 기술적 반등 신호, 테슬라는 단기 상승 전환 신호 관찰 중이나 전반적으로 하락 추세 속 숏커버 랠리로 본다. 넷플릭스: 3분기 실적 주당 21센트 예상 상회로 시간외에서 급등, 현재 388달러 수준. 7월 갭(385~392)을 메울지가 관건이며 392 돌파 후 지지 전환, 이후 400이 다음 저항. 385 이탈 시 360(100일 단순이평 부근)까지 하락 위험. 내일 갭상승 후 음봉/음의 캔들 출현 여부를 체크. QQQ: RSI 30 하회는 드문 매수 신호였고 그 자리에서 반등. 178.5 위를 유지하면 181~182 및 50일선 돌파 시 기술주 강세 전환 가능. 6월/7월 지지대와 200일선 부근에서 대량 거래 흔적으로 큰손 매집 주장. 현재 하락추세(일봉 기준)이므로 중기 상승전환은 아직 아님. 아마존: RSI 42, 30 하회 매수신호가 최근 잘 맞았다고 설명. 시간외 1848 수준으로 100일선 및 EMA13 위, 1845 유지 시 중간 볼린저밴드·50일선(1900~1920) 반등 가능. 50일선 돌파 시 완전한 강세 전환으로 봄. 실적 발표 전 랠리 시작 가능성 언급. 섹터 로테이션: 대마 관련주 조정 후 FANG 등 빅테크로 자금 이동 중이라는 해석. 다만 하락추세 속 숏커버 랠리라 경계 필요. 테슬라: 6.5% 상승, 48 RSI, 50 돌파 시 강세 전환 신호. 271 갭 지지 유지, 276~280 저항 돌파 및 290 확인 필요. 266 및 EMA4/8 이탈 시 하락 위험. MACD 골든크로스 진행 중이며 SEC 조사 종료가 숏스퀴즈 기대 재료로 언급, 300달러까지 상승 가능성 언급. 출연자 전망 요약: 단기 반등 시나리오 중심, 조건부 낙관. 하락추세 해제 전까지 추격 주의.
다듬은 글
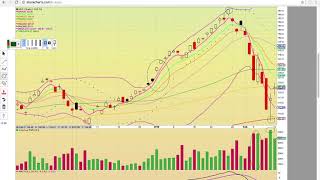
hi everybody this is Osprey I for my chart coach calm thanks for taking the time to view this video we've got some good news out after hours with Netflix there as you can see here they're soaring big after their third quarter earnings beat it was a big beat they they beat the estimates by 21 cents so yeah as you can see here the highlights very good numbers so it has Netflix running in after-hours trading so right now it's at 388 the last time I checked and so at 388 that's gonna put the share price up in this range right up here and it's interesting that that it's hitting this level because this is the gap level from back in July if you look back here between July 16th and July 17th there was a gap down open there's still an unfilled gap at that level now a move up to about 392 would fill the gap it traded above that level during after-hours trading but it pulled back below and that that's turning into resistance tonight it's gonna be all about breaking above that 392 level and turned it into support if it can head above that level then it's all about 400 the next big level you can see there was a lot of resistance it was a big support level here it's gonna be a big resistance level of heading higher and so it's gonna be a tough one to break as well notice how 400 is lining up with the descending resistance line so it's gonna be all about also stayin above this 385 level that is the bottom of the gap if it trades below 385 it could drop down and the downside risk is it comes down here to test this hundred a simple moving average at 360 560 that would be the next moving average support level below it right now with the closed down here at EMA 13 you're looking at a giant cap up open above all these moving averages so either it's gonna take off and keep running you know above the moving averages well or it's gonna pull back and test support and so one thing to keep an eye out for tomorrow is keep an eye out for a black candle or a red holo candle keep an eye out for Netflix trading below the open after a big gap open if it starts trading below the open it will be a single the Bears are attacking and that it could pull back and consolidate so that that will be a clue all right so it's gonna be all about breaking the top of that gap to head higher let's take a look at QQQ okay yeah we had a you know Tootsie QQQ is what we normally go with them that that was in play today and and we like to follow QQQ so you can get a look at the technology sector and yeah if you can see here that drop below 30 on our side that was the buy signal you know it's rare for QQQ to get below 30 on RSI and so when it drops below that level many times it's a buy signal also on Fastow you can see that was right where it was lined up with the last time that it bounced and so each time that it's hit this level below 20 on our side and down here below 30 on I mean below 20 on Fastow and then you know that that's been a I signal and so when it lined up with RSI below 30 that was looking like a good technical bounce level this is a chart that we've been working on so there's annotations started with the double top here that's what these annotations are from and then I posted some charts on the bounce down here on the 200-day simple moving average and then also off of this june/july support zone and that turned out to be the good re-entry level notice how the candles were all holding this this 170 120 that's the red line the 200 a simple moving average that was the reload zone as long as support held they tried to shake out here but it got right back above and then it had been working on the pink line that's EMA for at 174 92 there was a close above both of those levels today and then it was hitting the orange line above EMA is 4 & 8 and then and then it's hitting that the the orange line which is EMA 13 at 177 69 you can see after hours trading at sweat 178 53 so that puts it right here at the 100-day simple moving average and so it's gonna be all about trading basically above 178 50 to keep it easy if it could stay above that level that that should signal it wants to head higher and then you're looking for a run up to the middle Bollinger Band and the 50-day simple moving average it's gonna be all about turning you know if it turns that that 178 50 level then it's all about 181 to 180 150 getting above that 50-day simple moving average one eighty one sixty two would be a really good sign for the for the technology sector and that's where it can get moving and start heading higher as you notice back here the previous uptrend that the candles were all bouncing off of the Green Line that's the 50-day simple moving average that level broke on this red candle right here and that's signal the start of this downtrend and so it needs to get back above that level to get a new Uptrend going okay so we'll keep an eye on QQQ here a good sign it is down here look at the volume check out the big volume you got this lower wick here on this candle and a giant volume spike people you know big-money loaded off the bottom and then now everybody that loaded down here they're looking pretty smart you know it's or Lilliput 178 it's up $10 from where big money loaded always follow the volume bars okay you can't you know the the big players they like to hide their cards but you can follow them through the volume okay if you look at AMZN okay this is arguably that I mean you would say most people would say this is the number one company in the world and so what's going on now is we're having some sector rotation going on I know a lot of people were disappointed in the marijuana sector today yeah it had a big pullback and and one reason we've got this shift you know marijuana was pushing while the the stock market was pulling back it was holding up but now that we have the stock market bouncing and and and moving higher you know a lot of people sold those marijuana stocks and now they're jumping back into stocks like Fang so Fang had a really good day today so now with Netflix doing well with the earnings we might see the Fang start stocks start moving higher they already started today you have Amazon being the leader you want to watch what Amazon's doing it's up three percent today check out fast or RSI here at 42 when RSI got below 30 that was such a good buy signal you know and I did put out some information on that and that just turned out to be an awesome buy so congrats to everybody that was following that that's a simple one you know if you get a chance to buy Amazon below 30 on our side that's a no-brainer you know that's oversold that's a rare occasion that might happen once or twice maybe in a year if you're lucky and so in that this situation happens you know you're getting a good entry point the day that that happened you know when that when that was going on you had the candles way down here look how the candle was forming below that or Bollinger Band the spinning top formed completely below the lower Bollinger Band that's such a rare occurrence when we when we trade at the crappy small cap penny stocks this would be you know consuming a pretty good set up with the big volume bar here for technical bounce let alone if it's Amazon and then number one company in the world it was definitely set up for the technical bounce here big players loaded and so they you know they're being rewarded now and it's a but it closed today above EMA's four and eight that was the movie are looking for and notice how all these candles were below this pink line that's EMA for it had been trying to break that level well today there was a clear break above both levels and then the 100 a simple moving average at 118 29:43 that was the big level to break it didn't break that intraday but check out after hours it's at 1848 that's also putting it above EMA 13 if they can stay above 1845 it has a good chance of running back up to the middle Bollinger Band and the 50-day simple moving average that's up here in the 1900 to 1920 resistance zone once it gets back above that 50-day simple moving average that's when Amazon's back and fully bullish and a pot you know the uptrend can continue and so that this could be the potential start today's trading day this would be day one for the start of the potential rally into their earnings that'll be coming up you never know you know anything could happen and they could sell off tomorrow but tomorrow it's looking like a gap up open and yet just as always keeping out for black camel the black Campbell it is this candle right here notice how this was in a downtrend and then and then it was a gap up open and it traded below the open and then a red candle followed you know you have the black candle here and that was at a top and then it started the downtrend you know you had the black candle here that was followed by red candles you know sometimes you get the black candles in an uptrend and you know it keeps pushing higher but but a lot of times when you're when you see a black candle you know it signals that it could possibly take the pause or maybe pull back you know you have other examples here as well and so yeah just something to keep in mind yeah whoo keep an eye out tomorrow for the black candle just on that out there with the gap up open you know it's like we're everybody's you know glad to see the the market bouncing and having good day and see technology running but at the same time you have to be careful because the the stocks are in a downtrend right now it most most of these technology stocks are in a Down from the daily chart so the Bears are still in control this is just a short cover rally you don't have a new Uptrend until the middle Bollinger Band turns back into support and so it so they have a lot of work to do so just keep that in mind and - you know with the marijuana sector pulling back today when you know some people were thinking it was going to keep running that that that's definitely something to keep in mind ok so so yeah so we're gonna look here at Tesla yeah it closing up here at six and a half percent it sits right here at forty eight and the reason why I said that about the marijuana sectors because we were prepared in our chat for potential selvan news we had been talking a lot about it yesterday just getting everybody ready for that that could happen it just happened sooner than we thought it happened right at the open as opposed to we were thinking maybe they'd let it run a little bit in the morning and then people would start selling off later in the day but you never know when it's gonna happen and so or you know you just have to follow the charts so just putting that out there look at Tesla here you've got it at 48 on RSI it needs to get above that 48 level and get above the 50 level and that would be bullish once it gets back about 50 that should signal that it wants to be you know that the Bulls are back in control if they can stay above that level you have Fastow back above 20 here and heating up so what happened with Tesla here is you know it had come down that there was a gap back here in September between these two candles and so it came down here you know it filled with this this candle right here and then you can see it came down this candle you know these candles or you know this is filled it originally and so there you had this gap level right here these two green lines and today there was a closed back above that level because get gaps which can become resistance levels and even after they filled if you're trading below and so breaking back above it needs to stay above that 271 level that that's one key level to stay above and then also you can see here it filled this gap in October there was a gap between load and this candle in hive day on this candle and so it's hitting the top of the gap resistance level it's got to break above that level tomorrow too hire the last time I checked Tesla was flat and after I was trading it was trading around where it closed and so it's gonna be all about breaking that top of the gap level and then turning it into support if it turns into temporary resistance and it can't get above this 276 60 level that that's gonna signal more consolidation how would you know it's not working out if it drops below EMA is four and eight and drops below that 266 level that would be a red flag signaling downside risk you do not want to be long holding Tesla if it's forming candles below EMA for as you can see over here when it's below the pink line it's not good you know below the pink line not good yeah but the pink line is good you know that is good and so right now it's above the pink line and it's trying to cruise higher above emaze four and eight the next key resistance level the break is gonna be this middle Bollinger Band at 282 thirty-four if they can close above that level then it could get a new Uptrend going keep in mind the middle Bollinger Bands always tough to break once you're below if you look down here at the MACD you can see it's pinched right now and really hooking up the green lines the MACD line the red lines a single one and if it crosses over that consumable to start the next run you could see back here on the 17th you know that lines up here right about here and that was the start of a nice push higher and so that that's what you could have here if it fails to cross over that would be a red flag if you look here at Tesla on this chart that we've been working on you can see you know down here it had gotten it had dropped below 30 on this pullback yeah it didn't get below 30 on our sigh we could see that fast Oh below 20 once again below 20 that was the the bounce level it bounced back off of this okay so what's going on now you do have a cross over here on a DX so you have the Green Line crossing over the black line it's a sign the Bulls are heating up it came down and retested the level from September that this chart was made back here on the September drop and so you can see here it bounced off of this April support level back in September and ran back up and then it came right back down to that level and that's where it bounced off again this time this 250 support zone and so today a close back above EMA's for 8 and 13 the pink the the the pink line and orange lines and it came up here to fill this gap as we were talk about before notice how the gap is lined up with the prior support level from back here in May and in September and so that does become resistance it's gonna have to break above that level notice the next big level is up here at 290 that was a big support level as well and when you have a support level that does become resistance so if it gets above that 280 234 level keep an eye on 290 that will be a big level to break if you can get above that that's when it could get up there to that 50-day simple moving average that we were talking about and then if you look down here we have the you know I use both at 12:26 and 9 timeframe for MACD and the 813 and 5 the 1813 and 5 it signals a little bit sooner and as you can see here it's already crossed over it already has a bearish bullish crossover and so that the 1226 and 9s trying to follow along you know when you get a crossover sometimes you get big runs like back here you know it crossed over and that was the big push this was a crossover crossover okay and then right here on the chart big push and then you've got the you know crossover crossover and that was this rally right here and then now you've got the same setup so is this the start of the next push higher the the charts are signaling that but that's what the charts are saying that it's a Tesla SEC investigation is now closed and so maybe this is what the the Bulls need to get that short squeeze going and continuing and making a run back up to $300 all right thanks a lot from viewing this video if you'd like to learn more about charts and technical analysis please come check out the chat alright thank you


Comments 0