
저자: OspreyVision · 외국인
요약 보기
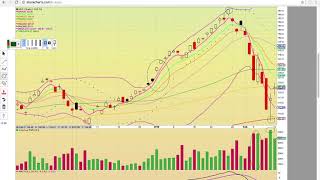
결론: 반도체 지수(SOXX)가 중장기 이평선 아래에서 약세 추세로 하락 위험이 크며, 숏(SOXS 매수·풋옵션) 전략이 유리하다는 취지. [시장 전반] 나스닥 선물 보합, 니케이 1% 이상 하락, VIX 상승으로 위험 신호. 단기 기술적 반등은 가능하나 큰 투매 이후 반등이 더 의미 있을 것으로 봄. [SOXX 분석] RSI·스토캐스틱 50 이하, 약세 교차 발생. 볼린저 중간선(165) 이탈, 주요 이평선(8·13·20·50·100·200일)이 모두 위에서 저항으로 작용. 지지선은 154~156, 추가 하락 시 150~151. 주간 100주 이평(약 161) 저항 여부가 관건이며 이탈 시 200주선(126)까지 조정 가능. [단기 반등 조건] 160 지지 회복 후 163 돌파 시 차익실현 구간, 165 이상 회복해야 추세 전환 신호. [SOXS(3배 인버스)] 13% 상승으로 반도체 약세 수혜. 풋옵션도 큰 수익. 거래량은 SOXX 풋이 더 풍부하다고 언급. [개별 종목] 마이크론(MLNX 아님 — 자막상 ML/MU 계열로 언급) 상승 추세이나 EMA 이탈 시 풋 고려. CREE(Wolfspeed)는 상승 추세 유지 중 39~43 구간 지지·저항, 43 돌파 시 상승 여력. 인텔(INTC)은 200일선(49) 저항 후 하락, 46 지지 이탈 시 42까지 위험, 애플 악재가 섹터 압박 요인. [리스크] 과매도 반등(숏커버 랠리) 가능성, 큰 하락 후 반등 대기 권고, 이익 실현 필요성 언급.
다듬은 글
hi everybody this is ospry from my truck couch calm and in this video we are gonna take a look at the semiconductors okay so they've been under big pressure as you can see here in Futures Trading tonight the the Nasdaq is is holding up here it's trying to find some support just everything's pretty flat right now just down fractionally okay so let's take a look at socks this is the semiconductor ETF and yeah as you can see it's been cooling down RSI and Fastow are both below 50 check out the bear cross here when the red line minus TI crosses over the black line eighty exit signals the Bears are heating up and so you can see here it's been dropping lower it broke below middle Bollinger Bands support that's the dotted purple line currently at 165 nineteen it was crucial to hold that 165 level dropping below does signal but more downside risk it cuz it can start another downtrend it can start pushing lower similar to back here where it closed below the data Purple Line and then the long pullback happened so right now this gap filled between these two candles between the 30th and 31st and it looks like it's headed down here to test support you know somewhere down here between 154 and 156 look look for a technical bounce if it were to close below 150 for the low close down here that's gonna signal more downside risk okay it could come down test this 150 to 151 support zone okay add to the upside there is a couple of unfilled gaps above and in order for it to reverse and in to get an uptrend going and for the semiconductors to be bullish again they have to turn the middle in Japan and to support they have to get back above 165 they have to get back above the 400 a simple moving average at 167 currently like the candles are forming below every single moving average on this chart okay the candles are writing EMA's for 8 and 13 resistance lower below the middle Bollinger Band which is the 20-day simple moving average below the 400 the 300 the 50 the 100 and the 200 a simple moving averages it doesn't get more bearish than that so just throwing that out at you so when it's super bearish what do you do you my foots right so you so people are trading puts today and they did well look at the percentage gains down here so yeah so congratulations everyone that was trading us socks puts you know yeah the the calls will get a turn on a bounce the bearish kickin reversal pattern that formed on Friday okay so our back here on yeah it formed on Friday these two candles formed the Thursday and Friday candle form the bearish kickin and then that was confirmed today so it had a bearish reversal confirmation so now you're on the lookout for a bullish reversal pattern so you're looking for support bullish reversal pattern somewhere in that may possibly that 1:54 zone if you look here at the weekly chart now this is where it starts to get pretty hairball because you you have the hundred week moving average at one sixty point nine nine as the crucial level to hold and it's currently trading below that level and it looks like it could drop lower so if that 100 week moving average which it's been trying to hold for the last four weeks if that level did turn into resistance it could signal a pretty big drop lower it's gonna be all about holding like I just said the 154 level that 154 135 because that was the the low closed in October it bounced off of that level in October in that that's where it ran back up to a mas four and eight on the weekly chart now if the hundred week moving average remains resistance the the the downside risk is it could retrace down to that 200 week moving average at 126 I mean that would be one heck of a pullback but that would be the downside risk that that's where the Bears would try to take it right now it's in a very strong downtrend like when there was a close on this candle in October below the middle Bollinger Band and below the 50 week moving average that single downside risk and it's been heading lower ever since until the EMA for at 160 380 turns back into support the pink line the the Bears are gonna be in control okay so let's take a look at the 15-minute chart so so let's say it does start bouncing the the level that has to get about on the 15-minute chart is 160 that's the middle Bollinger Band if they can turn 160 into support then get back above this high clothes in the sideways channel here about 160 50 just above that level then it could get moving and then what has to happen it has turns green line at 163 the 50 simple moving average back into support once the the 20 and 50 are back into support then it could try to get a push higher the top moving average is the 200 simple moving average at 167 you know stocks are not fully bullish until they're back above all the moving averages in the 15-minute chart writing EMA for support higher so it does have a lot of work to do there there will be some nice room to bounce for short cover rallies but right now that the signal is more downside risk if you see it trading above 160 then look for a run up to 163 that would be a profit-taking zone if it failed to break and then yeah if it got above that then it could possibly fill the gap between the 12th and the 9th between Thursday and Monday okay if you look at s o XL here this is a semiconductor Bowl three times and so this is three times s o X move so if you know sox10 percent then x 0 sx o XL would be down three times that so is down 13% so the three times can work for you if you've got the trade correct but it can also work against you if you if you called it wrong and so yeah so so with it being down 13% the way to go was to trading the the the puts and so down here we've got put options that were up nicely yeah you can see that they they were up you know 200 percent 100 percent if you check it out here 4 4 s o X X you know it had actually you know had one contract that actually pretty pretty return to even better gains I mean the volume was still pretty light on the volume but yeah it's interesting that that you know you know you're not necessarily you're not necessarily going to get three times the the the bang for your buck and the options so sometimes it you you want to go with the volume xoxoxo had great value you know a bit better volume than s o XX here so there's a little better volume and so yeah it's just a matter of what you want to go with yeah it know might regardless taking but loading puts was the call you know writing writing the semiconductors lower and so yeah what we have here is a break but back below that middle Bollinger Band currently at 105 78 and so that level needed to hold you could see it was really working hard trying to turn it into support it's so breaking today that does signal downside risk it did fill the gap between the 30th and the 31st and now it looks like it's heading it lower and so what you're looking at now is the support level from down here the this low close on the 29th basically it's got a hold it needs to hold the 86 level if 86 were to break then it could come down here a you know drop a low and test that 81 82 81 support level keep in mind you know there are the three red candles in a row so it so it is pushing to the downside but yeah until it gets back above EMA for at 102 64 it signals the Bears are fully in control once again this is trading below all the moving averages writing EMA's for 8 and 13 resistance lower that that's when you want to be short that that's when you do not want to be long okay and if you do play a bounce it's just the technical short cover rally until that middle Bollinger Band on the daily chart turns back into the support so yeah so you want to be able and you're like I don't like to freaking you know I don't want to be a shorting stocks or whatever I don't wanna be my inputs and so one way you could do that is through an inverse etf and so you have the the semiconductor bear three times and so this is ticker symbol s oxs and so if s o XX is down 4% s o XS is going to be up three times that and so this was up 13% today so it does the inverse of whatever s o XX is doing and so so yeah so so when s o XX is dropping you can go long you could be bullish sx o XS and you could get the upside potential 13% game is a great game for the equity you mean it that you know that yeah so the options returned you know ten times that but still if you just want to trade the the common this is still a nice vehicle to be able to trade when the market is heading lower so look at the chart here for s o XS it had a really bullish clothes it was a closed above the middle Bollinger Band and the 300-day simple moving average if both of those levels hold a new Uptrend could begin okay so this is a much better looking chart right this is what you want to be that this is this is a pretty chart this is a really ugly chart right and so who cares if you're a bull or a bear it's just you want to be right you just want to fall you want to follow the right pattern we don't really care about the ticker symbol what we care about of the patterns and this is a nice chart pattern it is up three days in a row and so for this trade to work out to keep working for the upside it has to hold 13 if it were to drop a little 13 that would signal downside risk and then that would put XO XL and s oxx back in play as long as candles are forming above the blue line and the data purple line the 300-day simple moving average and the 20-day simple million averages which is the middle Bollinger Band it signals to be long as s o X X and so what would it looks like it could happen if those levels do hold it could possibly retrace up to this 1450 level if it gets past that you've got this 1425 1430 and then really it's all about the high close there on the 30th which is right around 1580 a run back up to the upper Bollinger Band which is the top of the bullish upper Bollinger Band Channel today the close back above the middle Bollinger Band does put the share price back in that bullish upper Bollinger Band Channel what happens when you're on the bullish upper Bollinger Band channel well I'll show you the last time it was trading below the middle Bollinger Band down here when the gain of October and then it traded above look at the run that followed okay so it traded below the middle Bollinger Band for the first time since it broke above the first week of October was right here in this red candle today is the first day that it closed back above I'm not saying I said it's gonna run like this but I'm just saying this is a nice chart setup and that's what we do we follow the charts you know and so yeah yeah and so what do you do if you want to trade the options well then you would trade at 0 X X call options check out the nice percentage games you know 240 percent gain 100 percent 140 I mean that's a nice that those that's a nice day for anybody okay so yeah so that that's a good this is a good vehicle so you could go with the car or you can you can go with the the options both ways our winners okay if you look at buy semiconductors on the dip at Yahoo you could check this out it's an article that was that today yeah it talks about three semiconductors that you should keep an eye on it so let's take a look at the charts real quick its ml and x CR EE and IMTC this is what Zacks is recommending as the as the the ones to be looking at right now and so yeah as X is a very credible website and so in and yet we'll see what they can it will see how these charts look let's look at ml and X here so so yeah so this has a really nice uptrend going check out how the candles have been writing EMA for support higher they've been writing above ninety one sixty today there was a close just below that level and so what that is telling us is that the chart could finally break down for the first time since it had a close above the middle Bollinger Band on the over here back in the in October and so what could happen now with the close below EMA for is the candles could pull back and so if EMA eight at 89 54 breaks you could see a drop down to 86 78 even though this might be the the the the good one to be and if the semiconductors keep pulling back with the way ETF strayed they will bring you know the the cream will come down to the ETF's will bring everything down and so right now if it does start trading below EMA for that would put the that would make put options in play for a for possible trade just keep in mind it's really dangerous being long you know being inputs when candles are forming above EMA for on the daily chart that's when you want to be long calls as long as Ian May for is holding its signals more upside potential what's it drops below and that level turns into resistance that's when it you know pays to be short similar to back here you know when it drops below and so like right here it closed below EMA for and then you had a nice pull back you know and so right here close below a nice pullback close below nice pullback and so that's what's happening now close below are we gonna get the nice pullback if the semiconductors keep pulling back it will if the EMA for holds its signals it could head higher has break this high close here the 9350 resistant zone so take a look at CR EE close down four and a half percent today yeah so this one it has an interesting setup as well it's been pushing you know it has a nice uptrend going a good uptrend the middle Bollinger being down here turning to support as long as it's holding down here at 38 61 the uptrend is intact it has all the moving averages on the chart stacked up in the zone between 39 and 43 so so basically you know 39 is the bottom and 43 is the top and it's just in the middle right now and so going forward trading above the hundred a simple moving average in 43 that's gonna see more upside potential okay you want to be long call it's gonna be writing calls higher if these levels remain resistance it could come down here fill this gap between Wednesday and and our Thursday and Friday of last week and come down and test EMA eight at forty sixty eight if it comes down there and test that level and the semis do pull back further you know you could see it pull back test this at 50 and 300 a simple moving averages at 39 so so yeah so really you know to go long on this type of setup you know it's a lot of times it pays just to wait for that break above resistance to signal that it wants to hit higher and then you would use that hundred a simple moving average as your stop loss level it has to stay above that level if those levels are resistance it's kind of signal consolidation okay let's look at Intel for the last stock in this video and so this is a top dog right and this is that this is being pulled back with the you know Cree and in Intel with with affiliation with Apple with the bad news with Apple today and having their potential reduction in demand and so you know that that's putting a you know really hurting the the sector and so yeah this could get ugly here if it fails the whole support right now it's still above 50 on our side they can hold 50 that would be good if it drops below 50 that's gonna signal its heading lower look what happened the last time it was above 50 I'm gonna drop a low check it out right here that's that that's where it headed all the way down to here okay so yeah you don't want to be holding when that happens that's an easy sell signal you know if you're in in a stock and it's it breaks about 50 like it does right here and yeah it looks like it's pushing higher once it breaks below 50 that is a clear signal that the charts breaking down makes it a risk to hold also once it's breaks below 80 after trading above that's also a red flag and so you have that red flag so you have multiple you know possible red flags here another possible red flag is right here there there was one today where you had the red line - di crossover a DX that was a similar bears are heating up and then now you have plus TI minus di pinched if that red line crosses over the green line that's gonna signal the Bears are taking over that's the same thing that happened right here and see the red line crossed over the green and that's and then the big drop so that's you don't you know that's not very good yeah back here you know you have yeah I guess back over here over here notice how those were the drops and so that that that's the same thing that we have going on right now if it crosses over it could pinch and not cross over but that cross over on a DX is a red flag okay so as far as the candlesticks go it's all about the 200-day simple moving average at 49 I mean that's been the top look how many times it's hit that level it was support okay so it was it was topped out at the hundred days simple moving average the Gold Line it came down it found support at the 200 okay and then support broke right here in August and notice how it turned into resistance and so every time it hits that level it's the sell zone so once you have a defined sell zone every time it hits it you want to walk in games until there's a close above okay once if there's a close above then it then it then it signals to keep writing but if there's a close above and then it drops back below then you have to exit it becomes the stop loss level so right now that was the signal right here was the walking gains if you didn't lock in gains on this day when it traded above and then pulled back below that then the following day on Friday when it closed below without breaking that was your signal okay it's not breaking resistance and then today was the was the pay day for the Bears and bad news for the for the holders and so now it's testing the 300 a simple moving average at 46 58 the blue line if that fails to hold you're gonna have the middle Bollinger Band and the 50-day simple moving average on decks at 46 so really it's just gonna be all about four six if they can hold 46 then the uptrend is gonna be intact okay because that that level broke back here in October and it's been holding ever since if it were to break below 46 that's where you could get a pullback that's where you could have the 4350 level you know could possibly go back down to 42 it really has to hold 46 or else it could get ugly okay so yeah so this is Intel yeah Apple is bringing down the the sector and it's also yeah weighing heavy on the stock market so yeah we'll just have to see what's gonna happen tomorrow it many times Tuesday is turnaround Tuesday we'll see if the Bulls can get the bounce the Nikki here is under big pressure tonight as well down over 1% so yeah and then II do have the VIX up with the markets down everything's pretty flat but just having VIX green it is signaling you know there is more danger out there it's just you know after such a big drop where we're going to get a technical bounce tomorrow we'll have to see you know it would probably be better for a bigger shakeout and then get a big flush and then and then a nice bounce would be a big flush we provide a nice trading opportunity off the bottom you know if people play the dip too soon they could drop the flow you know pull the rug once again later this week you never know lots of headwinds in the market right now be careful out there take those profits when they're on the table and please come join us in the chat all right thank you you have to come to the premium chat all right thanks


Comments 0