
저자: OscarAI · 외국인
요약 보기
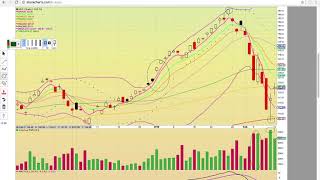
결론: 기술주 반등 초기 신호는 나왔으나 대부분 주요 이평선 돌파 확인 전이라 추세 전환은 미확정이며, 특정 가격 돌파 여부를 기준으로 판단해야 한다는 기술적 분석 영상. [페이스북] 시간외 +3%, 150~155 구간 반등 실패 이력이 있고 155~156(EMA4) 종가 회복 후 지지 전환이 필요. 160 돌파 필요, 162~163 저항대 및 300일선 통과가 과제. 방향은 조건부 상승. [아마존] 1.3% 상승, 100일선 지지 근처에서 반등 중. 종가가 EMA4(1413) 위를 유지해야 강세, 다음 목표 EMA8(1440). [애플] 약 2% 상승, 170~171 구간의 50일선 위 종가 마감. 172 상향 돌파 시 강세, 볼린저 중간밴드(170.33) 종가 회복이 확인 신호. 171~170 재하락 시 적신호. [넷플릭스] 2% 상승했으나 EMA4(280.83) 상회에 그침. 280.91(50일선)과 EMA4 위 회복 및 지지 전환 필요, 298 돌파 시 강세, 308 볼린저 중간밴드 목표. [구글] 1% 상승, EMA4(1024) 위 회복 및 200일선 위 마감. 1025 이탈 시 적신호, 1033(EMA8) 종가 돌파 시 강세. [마이크로소프트] 약 3% 상승(원문 '30%'는 자막 오류로 판단), 50일선(90.2) 위 마감. 핵심 저항은 볼린저 중간밴드(90.24), 92 이탈 시 추가 횡보 신호. [알리바바] 1.5% 하락, 장중 반등 시도했으나 미체결 갭 존재. 174.64(200일선), 175.92(EMA4) 저항, 이 위 회복 시 180까지 반등 기대, 실패 시 하락 리스크. [트위터] 2.6% 상승, EMA4(28.29) 종가 상회 전까지 하락 리스크 유지. 26.62(100일선) 지지 여부가 핵심. [인텔] 소폭 상승, 48.46(50일선) 지지 필요, 50 돌파 후 51(볼린저 중간밴드) 지지 전환이 추세 전환 조건. [엔비디아] 소폭 상승, 장중 약 11포인트 반등, 226 부근 EMA4 위에서 229 돌파 시 강세, 255(EMA13) 목표, 222 이탈 시 큰 적신호. [마이크론] 3.5% 상승, 49 부근 50일선 기술적 반등 후 EMA4/8 회복, 52 유지가 조건, 50 위 EMA13 돌파 시 56 목표. [전반] 기술주 연속 양봉 3일 이상 나오면 의미 있는 반등으로 해석 가능하다는 견해.
다듬은 글
hi everybody this is Oscar AI from my truck couch comm and in this video we're gonna look at the bank stocks Facebook Amazon Apple Netflix Google we're gonna look at Microsoft Baba Alibaba Twitter Intel Nvidia and micron okay so these are some of the top you know the top technology stocks and I'm just going to show you the daily chart and I'm gonna go over at quake just so you can see the current setup okay so so Facebook traded higher and after-hours trading that was up three percent and so what that's gonna do is gonna put it up here at EMA 8 at 150 335 as you can see it hit that level last week last Thursday and failed to break and pull back 155 basically 156 that's EMA 4 that's the pink line it needs to close above that level and turn into support and then also close above EMA 8a close above both of those levels tomorrow would be bullish if you see it stalling out at 158 that would be a red flag if it gets above 160 will be the level to break that was the close here last Thursday and then the big levels the 300 day simple moving average and EMA 13 that 162 to 163 resistance zone so it has a lot of work to do that the big thing is turning EMA's 4 & 8 into support to get a reversal going let's look at Amazon so Amazon closed up 1.3 percent today it is bouncing off of that 100 days simple moving average support zone it's a little bit lower down here at 1333 notice the close today was right below EMA for at 1413 and so it needs to break above that level Futures Trading is higher tonight so you know there could be a gap up open tomorrow you want to see it stay above this EMA 4 if it stays above and closes above that would be bullish and the next target will be EMA 8 at 14:40 4 you know there's been some good volume down here at the bottom for the thing stocks if you look here at Apple Apple closed up nearly 2 percent today so it did close above some key moving or some key moving averages and and it you know closed above emaze for 8 and 13 that's the pink lime and orange lines and then it closed above the 50-day simple moving average currently at 170 87 basically 171 and now it's hitting that hundred a simple moving average at 170 167 so if you see it trading above 172 tomorrow that would be really bullish and then it would need to stay above that level it'll be a red flag if it pulls back below and starts trading in the 171 s or 170 and then above 172 what you want to see is a close above the middle Bollinger Band at 170 332 once it closes back above that level that's going to be your clear sign okay yeah it looks like a new Uptrend is going to start similar to back here when it closed above back here when it closed above back here when it closed above each time that signaled the start of a new Uptrend failed a break 173 would be a red flag when tested okay let's look at Netflix closed up nearly two percent today so it closed up two percent and it's just barely made it above that EMA for at 280 831 level it closed at 288 94 so it needs to turn that level into support and then it closed right at the 50-day simple moving average at 280 913 that's that green line it has to get back above that level and and get above EMA for to get the reversal going if both those levels turn into resistance that would signal continuation of the downtrend Netflix is currently in a downturn right now above a close above both those levels would be bullish and then you'd be looking at EMA is 8 and 13 is the big levels to break once it gets above 298 that would be really bullish and then you'd be looking for a run back up to that middle Bollinger Band at 308 ok let's look at Google closed up 1% today so it you know it had a big bounce down here off the bottom and it did close back above EMA for currently at 1024 and then it closed above the 200-day simple moving average at 125 72 that's the red line so it's bullish that it's back above 1025 it needs to stay above that level if it goes back below 1025 that would be a red flag and then tomorrow you want to see it close above the line line it hasn't closed above EMA 8 since back here before that the downtrend started so it close above EMA 8 at 1033 would be really bullish it would need to keep the you know stay above both of those levels to remain and play for a long trade but what you're looking for now and now that now that to white Campbell's forming in a row for these fing stocks in for the technology stocks that have been dropping you notice how that there was a white candle and no bounce you know white candle no bounce and then you know over here went it starts to form that the multiple white candles that's when it gets the reversal going so this is a clue that it's trying to heat up but it just has to stay above EMA for if you look at Microsoft here this was the big winner today it did close up nearly 30% our size back about 50 at 51 this was a huge move above major moving averages as you could see here it started the day way down here below the hundred days simple moving average at 88 53 and then it ran and closed near high of day it did close above that 50-day simple moving average at 90 205 the big level the break now is the middle Bollinger Band at 90 243 I believe it closed in after-hours trading that 90 to 55 and so what you want to see is a closed about the middle in Japan it closed above that level in the 26 and it failed to hold and it pulled back so you're looking for a bullish changing trend you're looking for a close above and for it to hold similar to here and here and way back here okay so so keep an eye on that you know it needs to stay above that 9250 level tomorrow if it drops back below 92 that would be a signal it's not quite ready to go and more consolidation okay let's look at ba ba it closed down one and a half percent today and so it's been you know it hasn't participated as well and the in the the rebound but it did close above the open notice today's candle is a hollow red candle the the it shows that the the even though it was down on the day the the Bulls were actually controlling the action into the clothes there's still an unfilled gap between low of day yesterday and high of day today so you'll be looking for that gap to fill on the bounce if the bounce continues tomorrow and then the two big levels to break are the 200 a simple moving average at 174 64 and then that that EMA for at 175 92 if those levels continue to be resistance that will signal more downside risk once they turn into support then you're looking for a run up to 180 up to EMA 8 you know and so it's just that whole process of getting back above these moving averages has to get above that 200 a simple moving average okay let's look at Twitter here they had a nice day to closed up you know 2.6 percent it's you know it had that huge bounce but notice it's still below the pink line and so until it gets above EMA for at 28 29 with the close above and turns it into support it will signal more downside risk it was a nice off of the hundred a simple moving average at 26 62 that's the Gold Line as long as that levels holding it's the reload zone if there were to be a drop below that's when you could really see it pull back you know that the 200 a simple moving average is way down here 22 you have the support at 23 if you can get above EMA for then once again it's this EMA a at 29 there hasn't been a close above EMA 8 you know close just right at EMA 4 since support broke way back here in March so we're keeping an eye out for a bullish change in trend if you look here at Intel Intel closed-up fractionally today and so it had a nice bounce off of the the 50-day simple moving average down here at 48 46 it needs to hold that level if that level were to break and there was a close below then you'd be looking at a drop down to the hundred a simple moving average similar to February when it came down tests of that level so it will be good if it can hold it did close back below EMA 4 it has to break that 50 resistance zone it didn't get above 50 the big level is that middle Bollinger Band at 51 notice the last couple of times it's gotten above that level it's failed to hold and pull back and so it really has to turn 51 into support to get a new Uptrend going right now it has to break above 50 and hold 47 ok let's look at NVDA it closed up fractionally as well it had a big bounce off of the low as you could see they really gapped it down way down here at 215 it closed way up at 226 it was an 11 point at $11 moved today that was a huge move but it's still below that that you're just above that middle of EMA for at 226 20 and it closed right basically at that level it needs to turn that level into support and then get above 229 so above 229 tomorrow would be bullish and then you'd be looking for a run-up to EMA 13 at 2:30 255 if you see it struggling with 229 that could signal a temporary top as you can see the previous candles have been hitting that with the upper wick and pulling back and then keep an eye on that 222 you know at level if it drops below that encloses below that would be a major red flag it has to hold that support zone and finally check out mu this was actually you know one of the biggest gainers for the technology large cap stocks and it closed up 3.5% as you can see it had a huge bounce off the 50-day simple moving average at 49 so that was a nice technical bounce it closed back above EMA four and eight so it needs to stay about 52 if it dropped below 52 I'm close below that level that would be a red flag and you could see 49 tested again to the upside if you can get about 50 for this EMA 13 then that would be really bullish shouldn't you be looking for a run back up to 56 okay thank you very much for beyond this video we'll be seeing it we're gonna you know see if the technology sector can fall through tomorrow with another white candle that would make it three in a row that would be a major move if there was a three up days in a row for the technology sector all right thank you very much please check out our chat I'll put the link below the YouTube video


Comments 0