
저자: OspreyVision · 외국인
요약 보기
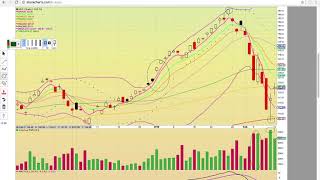
결론: 단기 반등 신호가 나왔으나 거래량이 약해 추세 전환은 미확정이며, 금요일 고용·임금 지표가 방향을 가를 것으로 본다. 다우지수는 큰 폭 반등해 2개 연속 양봉이 나왔고 EMA13 위 종가 회복이 확인되었으나, 중간 볼린저밴드(약 24,463) 돌파와 200일 이평선(약 24,051) 지지 확인이 필요하다. S&P500은 EMA4·8 위로 올라섰고 26,500대 EMA13 돌파 여부가 관건이며, 200일선(약 2,591) 이탈 시 하락 위험이 있다. 3배 레버리지 SPXL은 4,175(EMA13) 돌파가 필요하다. 나스닥100은 EMA20(약 6,560) 돌파가 핵심 저항이며, TQQQ는 EMA8(약 143) 돌파 시 EMA13(약 148)을 노린다고 봤다. SQQQ는 19,000 부근 재이탈 여부를 본다. 러셀2000(IWM)은 EMA13 부근 저항(150~153)을 넘어야 중간 볼린저밴드 회복이 가능하다고 봤다. TNA는 70달러 저항대, TZA는 11.73달러(50일선) 이탈 여부가 관건이다. 출연자는 거래량이 반등 때 절반 수준으로 줄어 투자자들이 금요일 지표를 앞두고 적극 베팅을 피하고 있다고 해석했다. 임금 상승률이 좋게 나오면 과거처럼 시장에 부정적일 수 있다고 언급했다. 전반적으로 신중한 관망 태도다.
다듬은 글
hi everybody this is Osprey from my truhe different indexes and we're gonna look at the different ball and bear ETFs and ET ins as vehicles to trade the indices so first EPS the Dow Jones Industrial Average and so that was a huge move today off the lows you can see it closed up nearly 1% and so what it needs to do is get back about 50 on our side it's currently at 47 Fastow it back above 50 is a signal the chart is heating up as you can see over here there there were two white candles in a row today okay so that was a bullish change in trim the last time that happened was back here on the 14th and 15th of March and so there was also a close above EMA 13 currently at at 2 4 1 9 3 and the last close above that level was all the way back here in on the 12th of March so so it's trying to get a reversal go in here it closed above the closing price here on March 26 you want to see that level hold and EMA 13 if it stays above 24 193 tomorrow that then the the that's gonna be putting this middle Bollinger Band on deck and that's the big level to break that's gonna be at 2 4 4 6 3 so if the Dow Jones Industrial Average stalls out at the middle Bollinger Band that would signal a temporary top if it can close above and turn that level of the support it could finally get an uptrend going right now it needs to hold this 200-day simple moving average currently at 2 3 4 5 1 if it fails to hold that level that would be a big red flag that it's breaking down lower keep in mind that there's some important economic data coming out on Friday and so that that's gonna move the markets and so depending on the wage growth ok so it's going to be the jobs report and wage earnings growth and if the wage earnings growth numbers are good last time that was really bearish for the markets so we're gonna have to see what happens so yeah that right now take a look at you do W so it's it's running it closed up nearly 3 percent today so that was a really big move it's bouncing off of the 200-day simple moving average currently at 80 50 notice how the open was down here at 78 it and then it closed down here at the just above EMA 13 at 85 46 so that's the big level to hold if they can stay above that that 8550 level tomorrow that's gonna stable more upside and it could run up here to this middle Bollinger Band at 88 68 that's the big level to break you know I didn't show it on the last trip at Dow Jones has this gap okay so there is potential for a possible gap fill if it does get up to that middle Bollinger Band and break above but first things first it has to hold that EMA 13 and then make a run up to 88 ET it's gonna be a big level to break you know there is a bullish crossover down here on the eighth 13 and 5 MACD but but it still needs to get a crossover on that 12 26 and 9 so take a look at s now this is short a this is short the Dow right here so check it out it's it's cooling down it had two red candles in a row with the giant red candle today and it did drop down to that 100 a simple moving average at 1928 support level okay so it closed just below if that level breaks and turns into resistance that'll be a red flag it was the first close below that level since it closed above all these candles were above the hundred a simple moving average until today and so if that breaks then you have the middle Bollinger Band at 1904 19's the big level if you see 19 break tomorrow that's gonna 4s Dow you know that'll you know it's gonna be be the signal that the markets are taken off and this could drop down to 1835 to the upside it needs to break this high close resistance level at 21 that that 21 resistance zone to breakout higher so take a look at SPX so this is the S&P 500 index you can see here it had a nice bounce today it did close above EMA's 4 and 8 so that was the first close above both of those levels since this drop began okay so the last close above EMA's 4 & 8 was back here in March on March 13 so it so it's trying to start a reversal here it's hitting EMA 13 at 2 6 for 9 that's the orange line it needs to close above that level so if the if it's trading above 26 50 that's going to be really bullish and then it has to break that 26 60 level if it does and that would put back on deck now if the fails to break that EMA 13 level that's gonna be a red flag and it could pull back it has to stay above EMA 4 and 8 now that it's traded above and then it also needs to hold this 200 a simple moving average at two five nine one as you can see here traded well below that today and then ended up you know there it was just a huge volatility today okay so so let's look at huge swings in the share price today and so and and volatility did it did move up and down as well and as you can see here with spxl yeah this this was a nice 3% gain today so this is the S&P 500 bowl yeah this is yeah so this is the three times and so it came down here and it closed above EMA's four and eight and the middle Bollinger Band currently at forty 22 okay I mean and not the middle Bollinger and above the 200 a simple moving average at forty 22 so it needs to stay about 41 that's EMA eight there at forty 89 if it stays about 49 that 41 that would be bullish and then EMA 13 at 41 76 is the next big level to break if spxl fails to break that 4175 level that would be a red flag and it'll definitely be a red flag if it starts trading back below 41 it needs to hold that 200 a simple moving average at 40 that's the big support level to keep holding if it drops below it would test that that 300 a simple moving average again down there at 37 so yeah above 41 would be bullish and then you'd be talking about a run back up to that middle Bollinger Band at 43 86 now if you look at SPX s this is the S&P bear SMP 500 bear three times and you can see it has a nice uptrend going at it but but it's cooling down so the upper treant started back here when it got above the middle Bollinger Band now there's two red Campbell's in a row with the big red candle today yeah this is definitely you know signaling the chart is cooling down it's hitting the hundred days simple moving average at 29 if it drops below that level then the middle Bollinger Band is gonna be on deck down there 28 27 it needs to hold them to the Bollinger Band the 50-day seven moving average at 27 81 to keep that uptrend going so below 29 would be it would signal downside risk and you're likely to see 28 hit to the upside it has to break this 31 50 resistant zone you know above that's 30 to 50 and then the 200 a simple moving average at 3350 okay let's look at Nasdaq this is the Nasdaq 100 yeah it had the big pullback as well and it's bouncing off of the 200-day simple moving average support zone and so today there was that that big closed back above EMA for at 65 14 that's the key level to turn in to support the next big level the break is EMA a at 65 60 so that's the that's the huge resistance level it closed right at it it that's also the closing price from last Thursday if you can get above that level that then the hundred a simple moving average in EMA for our email at 66 29 are the big levels okay so those are those are the two big levels above I have to get about that 66 30 resistance zone if it starts stalling out at 66 30 tomorrow you'll know that's a temporary top it definitely if it fails to get above EMA at 65 60 that would be a red flag okay so take a look at pro shares or ultra pro triple Q okay so this is a this is a following the the Nasdaq when it's going up this is going up as well and so as you can see today it finally closed about EMA for the last close above that level was back here on the 26th so it needs to stay above 139 30 if you see a drop below 139 that would be a red flag and then and then that 200 a simple moving average can get retested there at 132 50 that level needs to hold if the 200 a simple moving average failed to hold in that 300 a simple moving average at 118 50 would be on deck that the key level the break above is EMA 8 at 143 if we can get above that level then EMA 13 at 148 will be on deck it's it hit that EMA 8 level today and failed to break and so you know it's currently in a strong downtrend right now and it's trying to reverse you know the two white candles in a row you know that signaled the reversal here and the two white Kindles in a row signal reversal here and so now that it formed two white candles finally in a row is this the sign for a reversal it just has to do is follow through you know that that's the way it's performed in the past we'll just have to see if the pattern continues and so yeah this is s QQQ this is the - pro short triple Q and as you can see here it had that big pullback today so that was a nasty pullback after that big open had the big gap up open all the way up here hit that 20 50 level and then and then it pulled back dramatically closing near low of day so that was a really strong pullback it did close back below the 100 a simple moving average at nineteen fifteen it has to get back above that level if that turns into resistance and it breaks this EMA 13 at 18 10 level then that 50-day simply mean average and little Bollinger Band down there in that 17 support zone will be on deck okay let's look at IWM this is the Russell 2000 so yeah so this this had a you know the big pullback this is this is the small caps it came all the way down here it's hitting this a sending support line in the end the 200-day simple moving average at 147 that's the big level to hold today it did close back above the EMA is 4 and 8 so that was a bullish close you know there's the two white candles in a row you know the last time it formed the two white candles in a row you know that signaled the reversal is like you knows it can have follow-through again tomorrow you know it's setup for it is hitting the 100 a simple moving average at 150 256 so it's gonna need to break that level that's the next big level 150 250 and then that 50-day simple moving average at 150 342 those are the two big levels above you know it's hitting EMA 13 right now at 150 220 so it's basically you know this 152 to 150 350 level is a huge resistance level if they get above that 15350 then you have the middle Bollinger Band back on deck and then it could really get moving again up there at 150 438 okay and now let's look at T in a so TNA this is the small cat Bowl three times and as you can see here it's bouncing after the big pullback it did close above the EMAs four and eight it needs to get above EMA eight at 68 that's the big level to break it closed right below that level today it gets above that then you have the 150 and 20-day simple moving averages which is the middle Bollinger Band they're all between 70 and and you know 71 and so that's going to be the big resistance zone a thing if it goes up and it hits that 70 resistance zone and fail to break that's gonna signal temporary top if it can close above that could get a new Uptrend going so so first things first it has to get above EMA 13 you know you're looking for this kind of move you know you had the move up to EMA 13 you want to see a break above you know yeah so basically it's got the two white candles in a row this is what we had been looking for were you know this signal a possible start of a reversal and so now let's look at TZA this is the small cat bear three times and so as you can see it formed the two red candles in a row and yeah when you know the last two times that that they form the the two red candles here two red candles here you know it broke down it did form two red candles here and bounced and so tomorrow for TZA it needs to hold this 50-day simple moving average at 1173 if that level breaks then it's gonna drop down to this middle Bollinger Band at 11:38 it has to hold that level to keep the uptrend going if the middle Bollinger Band were to break that would signal a possible downtrend for TZA which is the small cat bear three times well and it would signal a new Uptrend for TNA and for the russell 2000 it would be a big signal that the markets are reversing if tza sqq and SPX s continue to be in an uptrend if they hold the middle Bollinger Band that would be a red flag for the markets okay because right now the the ball ETFs and ATMs here like spxl and then the the t QQQ and TNA they're all in very strong downtrend right now and so it's gonna you know they're gonna need to break resistance to get through the you know to reverse the downturn and get a new Uptrend going okay so tomorrow is gonna be a big day for the market so we're gonna see if today was a head-fake or if there's gonna be follow-through one thing to keep an eye on you know there was that big pullback today but volume wasn't super heavy and so yeah it wasn't a giant volume day so we'll see yeah we'll see you know that when it bounced in what made a big reversal before you know that there was a big volume for the IWM and then that you know XP SS you know had the big volume xpx had the big volume down here on the bounce and so this is a relatively a you know a lighter to average day for the indices and so you can see here I'm February when it bounced so there wasn't a big conviction you know there was it even though there was the big move today it wasn't on huge volume I mean look at that it's it's like half the volume with a move on the on the bounce from back here in February so that's something that that's a red flag just just in the sense that you know people did not load heavy here even though there was a big bounce it wasn't on giant volume okay and so what that's telling you at least this is my my opinion it is that people are worried about the the numbers coming up on Friday okay so people are not going heavy right now look how small the volume was today so that's that's you know that's a red flag just because yeah you know it to get a really strong reversal usually you need a big volume spike and so there wasn't huge conviction in the volume behind the move today and with the the numbers coming out on Friday I think that would be the big telltale you know on whether or not we're gonna break out higher or whether it could break down you know if the if the if they if the markets do not like the data that's coming out I believe it's coming out near the market open on Friday then that's gonna be you know you know that could put a lot of pressure on the market so I think people right now are playing it safe and so they're not placing big bets you're not seeing the big bets in the volume right now like you did back here in February so just something to keep an eye you know keep in mind when trading tomorrow you know so yeah thank you very much for eating this video if you like come check this out in our chat yeah I'll post the link below the YouTube video we are in the premium channel on the preemie chat so if you come check out the chat and there's nobody in the free chat that's because we're all on the premium channels so just let me know and I'll give you a free link to the free pass to the the chat you can check it out and see if you like it or not okay thank you


Comments 0