
저자: FXEvolution진행자 · 외국인
요약 보기
2022년 4월 20일 기준 실적시즌 긍정적(테슬라 실적 양호, 항공주 회복 신호). 장단기 금리차(수익률곡선) 역전 비율 50% 기준을 강조하며 경기침체 우려는 과도하다는 입장. 넷플릭스 급락으로 성장주(PS 밸류에이션) 전반 조정 우려. 나스닥은 박스권 횡보, S&P500 돌파 시도. 비트코인은 반등 시도 중이나 나스닥 동조 필요. 금은 2000달러 저항 확인 후 조정, 유가 WTI 104달러 돌파 여부 주목. 연준 파월 발언 앞두고 변동성 경계.
다듬은 글
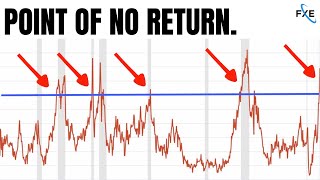
hello everyone and welcome back to the channel in today's video we discuss everything to do with the coiling ranges in these markets right now it's like they can't make a decision risk on or risk off what's going on well what actually is happening might surprise some people that have never viewed this channel before or never thought about the market differently so let's unpack what's going on in stocks cryptos and commodities right now see you soon it's going to be a great one well welcome back everyone to our daily show here where we really cover off on all the markets across the world this is for the market closed 20th of april 2022 and as we know it's earning season in the us so we'll start off there before getting into stocks cryptos commodities and everything else yeah tesla came out with its result it turned out it was a little better than expected let's go down here tesla rose four percent plus after hours earnings per share 3.22 versus 2.26 with an 18.76 billion dollar revenue versus the expectation of 17.8 this is good news for earnings season and as we know the earning season results here are sitting at around a 79 beat rate moving in yes netflix missed yes other stocks are missing but in general earnings is still high as we see this play out into next week if we keep above 75 plus i would say that's a good indicator that the q1 earnings have held up better than expected and that overall the market could be going bullish united airlines also another one that rose 5.6 after hours and that's really proving one of the concepts that we've spoken about here for quite some time at least two or three weeks which is that travel is coming back and the jets is showing us the way that travel is improving it's a sector that most people have gotten wrong for a long time yet it's starting to make the recovery trail this is most likely the real one think about all of the things going on in the world and then of course think about what people are now starting to do if your friends are traveling sometimes that's a good sign a pre-indicator that people are ready to move and i can tell you quite a few of mine are certainly getting ready to go overseas spend a lot of money on services and do that type of thing let's talk about one of the most important charts that people are overlooking i think and that is the treasury yield curves now we've discussed u.s two versus ten year and all these other things to do with recessions i would never discount this chart what a great concept and i'm not sure who shared it exactly but in our public discord community under economic news this was shared this economic chart great share fantastic even to me it adds a lot of value this is basically saying that if over 50 of all the treasury yield curves are inverted it's a higher statistical chance that that's the real canary what a great concept adding all of them together and basically saying that each time when this happened it was the true indicator before recessions it's very accurate it cleans up a lot of the wrong times the early times eg the point here before let's say uh the gfc or any of those types of things and it really shows you the big powerful ones coming and i think that's a great one right now are we at 50 no so great great share thank you very much for that and i think it helps everyone in the community we'll keep bringing that chart back in over the next couple of years as we break down whether we think we're in a recession time or just a pullback that will end up leading into a bullish move remember when everyone thinks that we're in a recession it's unlikely to happen just like when everyone thinks you're in a bubble the bubble doesn't pop until everybody gets in on board that train think about hyper stocks recently how high the valuations got everyone believed it sucks everybody in and then all of a sudden it dumps off speaking of hyper stocks netflix fell 35 in trade that is a big move that took facebook it took tesla it took disney took hyper stocks in general down anything that's valued at a ps ratio at the moment fundamentally got absolutely smashed and netflix is really the precursor to this so all eyes will be on anything that's valued at ps ratios from now on to see whether netflix was an outlier or not expected volatility at an extreme level in this sector other than that most things were green and actually the market did pretty well on the s p 500 to put in perspective of when growth isn't growth anymore eg netflix business at the moment this is what happens it goes from being valued at an eight times price to prospective sales to ten times all the way back down to where it was in the beginning so around this four three and a half is probably more fair for netflix business right now and this is a price where you would think it probably stabilizes what an amazing turn from being the darling of wall street included in the fang all the way back down i'm sorry for people that hold this but unfortunately that's what happens with growth stocks when they stop growing it gets smashed and that's what happens now where did all the bulls go we bought this chart up in the previous session and we know that if the bulls are not around based on this indicator that it does tend to lead into actually better returns now what does that mean of course it goes back to buffett's concept of buying fear or buying a lack of faith it looks like on the 14th of april we got this reading again very low reading and that is usually led into actually percentage statistical bullish moves over the next three months six month and 12 months you know it's hard to fight 93 96 and 96 to 97 over the next period certainly an interesting one there as we mentioned we're in earning season at the moment it's a 79 beat rate we'll continue to update you if you subscribe to the channel on how much the percentage beat rate is very important we know the overall because that's going to be a big thing as part of whether this market can take risk on or not tesla so far i'd give that a little tick well done um airline companies so far give that a little tick bank so far we'd give them a tick let's see what american express can get done snap that's the that's the new one that everyone's looking at thursday after the close please remember that is coming out and it will hurt social media depending on how it goes if it goes bad or watch out facebook watch out all of the rest of them if it goes good then of course we'll look at it now i want to just really show a chart that i think really exemplifies that markets are not all equal at the moment this is the dow and does the dow look weak on your charts we've got a trough down here we've got a peak we've got a higher trough do we get a higher peak the dow is actually doing incredibly well the us 30 is doing incredibly well and in comparison to others it's really holding up if you take a look at the vix remember the vix is based on the s p 500 also holding better than some other markets at the moment it's declining here which shows us that fear is coming out of the market and of course if it goes under like an 18 and a half what's that really telling us that the bulls are back and potentially risk is back on across all sectors at that point as well the vix will be something we need to continue to watch here over the next few days if we take a look at the us 10 year as we mentioned it hits that three percent that's a resistance and we know the us tenure trades fairly technically because it stopped last time right on two just before two hit it sold off a bit what caused or what happened after that we got a little bit of a rally into technology so we saw a little bit of a rally risk on now it's rejected at 2.98 and it's gone back down to 2.86 so keep watching this u.s 10 year depending on how this trades if it keeps dropping there's a good chance that we might actually see a bit of risk on coming through and that's going to coincide with some charts we look at later in today's video pcc put call ratio actually showing us that there's a decent amount of calls being opened here on the short term in the markets more calls than puts not necessarily great i would rather that we had more puts being open in the market but it's in the middle of nowhere so it doesn't help us too much we will update you on if that becomes worthwhile dollar index often seen as a risk on or risk off sentiment indicator we had the breakout at that point really what happened we saw the nasdaq start to decline and this has dropped in the last 24 hours now it's recovering a little bit but if the dxy continues to fall is that a good sign for risk on i would say that's a little bit of a tick generally yes it's fairly strong let's move over to gold now gold took a massive dive off that fib so if we take the fib here of the top to the bottom we obviously expected it to get back to this 61.8 fib 2 000 an ounce just stopped shy of that 19 was this 9 8 or 9 7 that's really where you need to take your profit though you need to go a little bit earlier than what you expect and it's sold off that point so currently it's finding a little bit of buying pressure around the previous resistances that's acting as support it's rallied it's hit the moving averages here on the four hour and it's currently selling off what you need for this to do is to go bang pull back a bit make a new peak if it makes a new peak cool next rally point 1980.
so that'll be good for day traders if it makes a new trough that's very bad be very careful in gold at that point gold is susceptible to the us 10 year as well so if the us 10 year does start dropping you might expect actually gold to do better than you think so again breakthrough that 1960 could be a very good level here for gold we'll continue to watch it let's move through to wti that is oil it recovered somewhat as well looking for a break above 104 per barrel if that happens it's kind of you know come down had a pullback we moved back into maybe some risk on there at this stage bit hard to tell what exactly oil wants to do it's still bullish but yeah that could be a max payne that's been caused here you're looking for that 104 to tell the tale or the story as we mentioned tesla closed down so it closed down 4.96 but then after hours it rallied straight back up what is tesla doing it's coiling guys look at this thing it's stuck in a range and when tesla breaks out of a range it tends to do it in style that is it goes for a big move so hopefully if tesla buyers keep rallying it they might even try to squeeze it after you never know retail traders do wild things on tesla so if you see a lot of call options starting to get opened that actually may continue the rally through remember tesla is well known for going euphoric and if it does break out of this range especially to the upside it could be quite a nice trade so keep watching that over the next 24 hours i think it's one to watch in the next open we'll find out what it does obviously bears if it breaks below well you know the next stop zone it's gonna be around that 940 945 let's move over to netflix so anyone that bought the dp got punished yesterday unfortunately that is the nature of the current market if you buy it on the open by the end of the day you would have been almost ripping your hair out because it went down so much and then rallied a little bit near the close i did talk in our private live streams about how to take this type of trade if you want to it's it's a very very risky trade as you know you're trying to buy the bottom for an investor it's different to a trader if you're trying to just get a dead cap bounce or something there may be one but the market started to trap people a lot before bouncing think about over here at the first day it went down and up then it went down again then it went down again then it went down again then it rallied so you've got to have kind of nerves of steel on these types of trades trying to pick the bottom on something that's unhealthy and the market's pushing it through you're trying to basically buy capitulation buying the ultimate fear it's a good trade if you know what you're doing but you've got to have a very good system that you can replicate through these points so netflix unfortunately quite low let's talk about risk on risk off sentiment xly is one of the ways that we can do that and this shows us the american consumer to a degree we've got a left shoulder we've got a head we've got a right shoulder we've currently pulled back down to that level and we'd expect this to rally in the next session based on of course tesla and other things so if we break back through this is really where i guess you know we we see whether the market's prepared to go risk on again and if they are then we move up hopefully to the 190 and if we break through there then it should be good times for technology along with risk on in general at this stage we're right on support so keep watching that iwm closed above this level here the 202 it closed above the 202 just didn't hold a green candle but it certainly balled up and it definitely broke out of the coil could that be an early indicator that we've got movement here in financials and then also we've got because remember financials make a huge part of iwm and that we've also got a bit of a rally that could come through general risky assets obviously not the ones on ps ratios but yeah that could be a good first sign here nasdaq now this is where things get different we've got a coil i think everyone knows the resistance you have a resistance on the real market of around 14 200 and let's call it 65.
we've got a support here and we are stuck in the range every time it rallies it gets sold off and every time it comes down it gets bought up in the current market you would almost think based on tesla earnings if snap holds up as well we might be starting to see some rallies coming back through netflix didn't do anything to help this but overall of course this is a fight between the bulls and the bears current sentiment is down on the nasdaq there's no doubt every rip rally has been sold if it breaks through would that be very strong i would argue yes even some people will probably come up with here and be looking for that thing to rip back into 14 600 and i think that's probably where it goes if it breaches through it's most likely going to that level so something to be watching a lot of moving averages here a lot of resistance if it breaks through and it comes up again i would say it's got a good chance of holding through and a lot of that comes down to these candles look at those last couple of hours of trade little rejection little rejection sold off if we rally back through that point there on the day trade let's have a look at this on a 15-minute chart just to break it down here we go look at this little 14 100 if we rally through that point it's not super strong but you can look at this and say well wait a second does that push us towards this 14 260 i think it certainly could and of course any further sell-off where do you go back down to the lows putting pressure down this side and then the bears win this is a fight between the bulls and the bears in a coiling space you can tell in the futures they don't really know what they're doing another long leg doji here on the daily futures market resistance support breach good news breach down bad and then of course it's sell the rips at that point guys and who knows where tech's going next we'll have to continue to spot that let's move over to the s p this is where the story gets a little bit better the actual broad market is holding as best it can it actually closed above albeit with no green candle where it created a long leg doji on the four hour and then it closed back down at the support doing a good job to fill the gap that was caused and then rally it through once and we're sitting right there i mean it is time for this thing to find bullish pressure in the next 24 to 48 hours if it's going to do so let's have a look at what the options are telling us about strike though so first up we'll go over here to the max payne max payne is 445 basically where it is right now this is telling us that the market would love it if they could just leave it at the current price to make the maximum amount of money off options okay but have a look at this here is the big one 450 strike calls so you've got a lot of put sitting around that 445 then you've got not much sitting between 445 and 450 now if we go back over to the s p 500 think about it where is it it's currently sitting around 446.
so 450 where does that put us at the next point of resistance where we actually think that it could go right now and rally to does that make the most sense for the friday close to push it into that 450 even though that's not necessarily max payne but it's certainly where all the calls are going to expire worthless the bulk majority of them again look at this chart where's the bulk majority of calls it's all sitting at 450.
so we are sitting above it looks better obviously the nasdaq is doing its own thing it's coiling in its own range the s p 500 is kind of breaking out and trying to go long and if you took out tech it's already looking a lot better and you can kind of tell that by the dow to the degree and how that's looking on the charts let's move over to our bitcoin discussion obviously we're not going to really change this too much in terms of our general philosophy on bitcoin as an investment we're still thinking around that 900 to 1000 days coming back and looking at the charts at that point the halving i'm not unsold on this concept yet of people bullying into the halving i just think that when everyone forgets about something they tend to uh come back in and buy it later on when it comes down to halving events and that's what's happened in the past and you know it happened in 18 19 why wouldn't it happen again this time around let's now look at bitcoin it's trying its best to go bullish but the market the nasdaq is not helping it risk on almost happened look at this eight hour chart it breaks up and it sells directly off that is nasty creatures right there then it creates along like doji you know bitcoin wants to go bullish you can kind of tell it wants to do it but it needs the rest of the market to come along next stop would be 45 000 where we test the previous resistance again and we've had that max pane and at this stage it looks more bullish in the bearish but it's right around that resistance coiling its way to hopefully some bullish action over the next 24 hours let's move over to bitcoin shorts bitcoin shorts here guys yeah it's not really doing anything i would say they're slight the whales are slightly lowering their shorts maybe that's a good sign overall not too much information ethereum very similar to bitcoin but not holding as well as bitcoin bitcoin bulls trying to hold it up better than ethereum is ethereum creating a long leg doji here on the daily closure above that what a great signal that would be very very strong at that point and you'd think that the whole market as a whole including the nasdaq would be risk on at that point that's how this ethereum bitcoin is kind of trading through at this stage if you haven't already follow us over on twitter at fxevolution we're almost at 5 000 followers thanks to you guys i've shared here the treasury yield curve of course today really important chart what a great concept i look you're always learning every day everyone i've always believed in three months ten year two year tenure but this is a great concept i like it very much and i think it does make some sense so i'll be of course looking into that over the next few months myself and that possibly bring it in why wouldn't you if it's a good idea why wouldn't you thursday is our good friend chair powell coming out to have a discussion oh my goodness the tools are coming out guys he's going to be talking about tools he's going to be talking about all these great things and yeah who knows what he does to the market we can't really interpret him in general pal says something it goes down then possibly it goes up after he talks about it some more so fed chair pal speaking 1 pm on thursday be careful of that event it's going to move the markets as you always expected too and then right other than that we've really just got the economic data next week is massive earnings make sure to subscribe for that if you enjoyed today's video give us a thumbs up we'll see you in the next one bye for now



Comments 0