저자: Ospry · 외국인
요약 보기
결론: 발언자는 SRAX·NVDA·DPW·HPE 등 비트코인·블록체인 관련주를 차트 기준으로 대체로 강세로 보며, 비트코인 1만 달러 접근을 강조함. SRAX: 일봉상 저항 돌파 후 다중 일 상승 중이며 과매수 구간. 200주 이동평균선 약 5.87달러가 핵심 지지, 이를 지키면 10~11달러 구간 상승 여력 제시. 주요 저항은 9달러대와 11달러 고점. 강세 방향(단기~중기). NVDA: 장기 상승 추세 지속 중이며 EMA 지지선을 타고 있음. 중간 볼린저밴드(약 210달러) 이탈 시 50일 단순이평선(약 196달러) 하락 가능성 언급. 장기 보유 관점 유지, 거래량 감소는 약세 다이버전스 리스크로 지적. 방향: 상승 유지(장기), 단기 조정 리스크 존재. DPW: 금요일 시간외 상승으로 107달러 부근, 6월 고점 돌파. 주봉 200주선(약 81달러) 상회 마감 시 강세 신호, 300주선(약 85달러) 돌파 시 상승 여력 확대. 목표는 205달러 전고점. 강세(단기~중기), 이전 캔들의 망설임 신호는 리스크로 언급. HPE: 비트코인 랠리에 참여하지 못했으나 대량 거래 동반 매수 흔적 확인. 13.5~13.8달러 구간 회복 시 상승 전개 기대, 갭 메우기 목표 14.1달러 제시. 단기 강세 관점이나 조건부. 비트코인: 발언 시점 약 1만 달러 근접. 과거 5,000달러·7,000달러 시점에 10,000달러 도달을 예측했다고 회고하며 자신감 표명(과거 설명이며 향후 가격 예측은 아님). 리스크: 대부분 종목이 주요 지지선 이탈 시 급락 가능성을 전제로 한 조건부 분석이며, 발언 내용은 기술적 차트 해석에 한정됨. 출연자 전망은 전반적으로 단기~중기 강세 쪽 우세.
다듬은 글
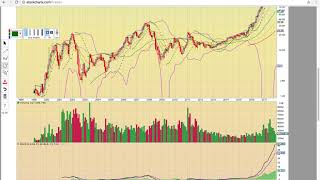
hi everybody this is ospry from my chair couch comm and in this video we're gonna take a look at some more of the Bitcoin and blockchain related stocks so first up let's take a look at SRA X it's breaking out here above hide close resistance you have our siding pesto and the overbought power zone a bull cross on a DX here and so this has been on a multi-day run it's going on a six-day run here the the break above the closing price and the seventeenth on Wednesday of last week was signaling more upside potential and then there was really nice follow-through on Friday so - yeah the currently currently the Campbells are busting through the upper Bollinger Band if they do pull back this EMA for at five eighty seven is the first support level if it pulls back a little that you really want to see the the high close back here at the five dollar level turn into support that would line it up with a maa eight you know getting really steep here on MACD notice how the MACD line super steep on both timeframes so yeah it's pushing really hard if you look here at the weekly chart each candle on this chart represents one week of trading you can see how it started this new Uptrend back here in September with the close above the middle Bollinger Band that's the data Purple Line then it got above the 50 week moving average here currently at 256 back here in October and then finally this week it broke above the the 100 week moving average which is at 486 and then the 200 week moving average at 587 so that red line there that the 200 week moving average is the key level to turn into support if the candles pullback you want to see that that 587 to 6 dollar level hold you know that would be the key level to bounce off and then to the upside you know the big resistance levels to break are gonna be right up here in the $9 own and then you have the high close up here at 11 so yeah some key resistance zones to bust through so yeah so this is a really nice move if it can stay above 6 it could push back up there to that 1011 dollar range okay let's look at NVDA this has been an epic stock just on a super long uptrend for you know just been a great long-term investment the the candles are just riding EMA for support higher here on this daily chart you know it's been riding above that level for multiple days you know it has come down tested the middle Bollinger Band on that level hold held as long as the middle Bollinger Bands holding but like it did on these prior attempts a test of support that the up transient intact and now that lure the middle one Japan's currently at 210 if that breaks you could see a drop down to the 50-day simple moving average that's currently at 196 similar to these candles back here so so yeah that could be a big drop between one to ten and 196 so you it needs to keep continue holding that middle Bollinger Band as long as that middle of Bollinger Bands holding you know the the long-term signal is to keep writing you know this has been a you know just a heck of a play it's trying to break out higher here you could see the high close resistance level what was the closing price here and and in that there was a close above that level on Friday so that is signaling more upside potential for nvda if you look here at the monthly chart you can see it's just been on this awesome multi-year run the the the middle Bollinger Band turned into support back here in 2013 and then it's just broke out higher so so it got above the the 50 and 100 month moving averages and then it's just been riding EMA for support for it for multiple months even though the last several years you know you have to go way down here into 2015 to see the last close below EMA for on the 15-minute chart you know attest to that level a couple times but it's been holding so as long as eBay for 25 is holding the the long-term swing trade signal is to keep riding now if there's a close below that level it could drop down to the EMA 8 at 171 as long as the middle Bollinger Band way down here at 111 is holding this up trims intact that would just be a big drop between EMA for in the middle Bollinger Band you know this has been a nice multi-month multi-year uptrend if you look though the one the one bearish divergence is declining volume so volume has been decreasing as the share price is rising so keep an eye on that let's look at DPW okay yeah this formed a very odd candle on Friday it formed that the black spinning top you know it's got you know it's always difficult to chart when they when they form odd cane like this and this is just an odd chart in itself there was a gap up open between Wednesday and Friday and so that there is a space between the chart between hive day on Wednesday and loved and Friday now the share price on Friday it actually ended up running after hours and so the the share price is currently way up here at 107 so it's busting above the high from June and so what happened was no slow long lower wick on Fridays candle a long black candle was forming and and the Bulls were able to drive the share price off of lo of day now the 15-minute chart for DPW was remain bullish the entire day never closed below the middle Bollinger Bands so that was a similar was still in play but this candle here was a red flag it signaled indecision and that the candles could possibly work back into the Bands if they do work back in the bands that EMA 469 is that first support level now if you look at the DPW weekly chart you can see the break here above the 50 week moving average it's way down here the the moving averages were all converged between 54 and 68 down here and so that there was a break this week above all the moving averages in it closed right at that 200 week moving average at 81 that's the red line and it closed right below that the 300 moving average at 85 if you see a close above this blue line for the week that's gonna be very bullish that's gonna signal more upside potential if they can stay above that level it could head higher and then the dollar lands are always a big level to break you know there's a couple of key resistance levels you have the high cloves right here from back back here in August of 2016 that's about 95 cents or so 97 and then above that you know the dollar lamb levels are always a big level to break you can see 2015 it was big resistance so $85 man get above that then it can really get running and you can see the pre prior high was way up here at about 205 and so that would be the target if they can get above that 85 and dollar land level okay let's look at HP e hewlett-packard has been up you know they're saying okay so this is a Bitcoin blockchain related but it's not really you know participating in in the big rally here and so if you look down here that at the pulled with a big candle on Wednesday notice the long lower wick on Wednesday's candle and then check out the big volume bar so it does look like there was some heavy loot loading on hpe so we're gonna see if they can work its way back into the up to that middle Bollinger Band currently here at 1363 notice how the moving averages are all converged here you've got Ian May 4 8 13 the middle Bollinger Band which is the 20-day simple moving average and the 200 and 100 a simple moving averages all conversions between 1347 and 1380 the top one here is 100 a simple moving average then get about 13 80 you could see a run up here to the 15 a simple moving average notice how it ran to that level the last time it failed to get above that's the huge level on this chart if they can get back above that 15 a simple moving average then you can possibly see it break through this upper Bollinger Band and run back up to this 15 resistance zone so keep an eye on HPE you know that the 15-minute chart here is heating up as you could see here there was the big volume notice the load so this looks like loading down here you know people filled up the boat here and that that 12 to 13 range it looks like look at the big volume bars so so it looks like bottom feeders were loading and then they're there they're there they're trying to push the the share price higher notice there was another big volume spike right before the close and that was on that was the day before Thanksgiving there was no training on Thanksgiving and this was at Friday's action and you can see you know there wasn't as much volume it was a lighter volume day but the uptrend continued and so you've got this nice channel going here and so notice the candles have worked their way back up to this red line and this red line is the bottom of the gap there's a gap between low of day on back here on the 21st and a high of day on the 22nd and so if they can break above this bottom of the gap level of 1340 then it can really get moving notice that it's trying to turn the Green Line into support that's the 50 simple moving average at 1333 so if you see it above 1333 that's gonna signal HPE is in play and then if they can get above 1350 here this 1350 is on 13 15 13 15 13 simple moving averages and then the top moving average level it is up here at the hundred simple an average of 1367 once above that then we'll be looking for a potential gap fill up here at 1410 about a run up to about 1410 would fill the gap so keep an eye on HPE all right thank you very much for viewing this video Bitcoin is currently hitting close to 10,000 you know everybody was calling it you know who didn't you know the lots of people were saying that but we did say that as well you know when it was at 5,000 you said it was heading to 10 and we said that again at 7,000 and now that 10,000 is right here it's just pretty amazing Congrats everyone come check us out on our chat we've got a crypto chat going we're discussing all these Bitcoin and blockchain related stocks and yeah and in the currencies themselves okay thank you


Comments 0