
저자: CNBC Television · 외국인
요약 보기
CNBC 기고자 Katie Stockton은 어제 시장 급락을 차트로 해석하며, 지난 한 주 여러 지지선이 깨진 결과라고 설명했다. 그는 S&P 500과 나스닥 100의 과거 대폭 하락 사례와 현재의 차이를 짚고, 신용 스프레드 지표가 정상 범위를 벗어났다는 점을 위험 요인으로 꼽았다. 유가는 큰 삼각형 형태를 만들고 있으며 WTI가 103달러를 돌파하면 추가 위험 신호가 될 수 있다고 봤다. 또한 S&P 500의 6번째 지지선 약 7000 부근까지의 하락 가능성을 언급하면서도 단기적으로는 건설적 입장을 유지한다고 밝혔다. 전략으로는 약세에 팔지 말고 반등 때 깨진 것처럼 보이는 종목, 특히 AI 관련주를 매도하라고 권했다.
다듬은 글
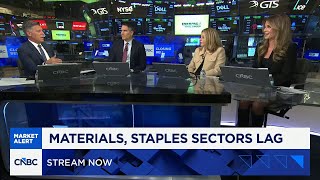
Let's find out what the charts tell us about yesterday's market sell-off. Joining us is Katie Stockton, founder and managing partner of Fairlead Strategies, and a CNBC contributor. You and the boys are looking at strange things. There is a pity that indicates that there is still a lot of work ahead, or there is a " flush in the toilet" when it seems that the worst is behind us.
What do you think you saw? A little bit of both . And I wouldn't call the price strange. I mean, that's really the most important thing about investing. Yesterday's drop—obviously, a lot of support levels have been broken over the past week , and yesterday it just got worse. But when such massive down days happen , it's usually debilitating in the short term.
We look back only at percentage declines for the S&P 500 and Nasdaq 100. The last time it did for the S&P 500 was just a day or two before the low on April 25. And for the Nasdaq 100, it was right at the low on March 20. So , it's interesting that recent big drops like this have been at major lows. The difference now is that we haven't really seen a big correction in duration or even in the fall from the high.
So, that's what makes the situation different. This is not necessarily a positive or negative, but if we close the month at current levels, it will hurt the monthly metrics that we track . And maybe that's not a problem for the end of the year, but for the first quarter, it brings me back to the sentiment of the end of last year.
We had a slight increase in volatility in November . And although we saw a good finish to the year, the first quarter was quite difficult. Does this sound like liberation day and the start of the war in Iran? We had serious breakthroughs in both cases , but they didn't last long. It hasn't been long since we've reached new all-time highs in most indices.
Will it happen again, or is it unlikely this time? This time everything is different. This is not Yes, this is really different. It's also different from a technical point of view. that this time everything is different. But this may take some time. It is Yes, and It has fundamentally changed in Washington .
Does this matter to you from a technical perspective? Well, what matters is how it affects the price, right? For me. Remember, last time I was here, we talked about credit spreads and how they were getting a little worrisome. Just in the last couple of weeks, one of the metrics we track has gone out of bounds.
And this is one of those long-term risk factors that we track and that matters this time. Of course, this is different from the April 25 low. for you? This simply indicates that there is risk in the system , obviously credit risk. The stock market is not taking this very positively. Even So now we take a more neutral stance on yields and the dollar.
We expect more stabilization in the gold price. As for crude oil, it has found itself in a large triangular formation, which is neutral in itself. But when you see a breakout up or down, it usually becomes quite explosive. And triangles most often resolve in the direction of the prevailing trend, which, technically speaking, is still up for oil prices.
If we were to see a range breakout above $103 per barrel WTI, that could be another risk indicator for the S& P 500. I don't think it's inevitable, but you have a feeling that the S&P will enter correction mode. And do you have a feeling that the Nasdaq will go into bear market mode? I think we have some signs of that, yes.
It depends on how we close the month. But in the meantime, I think we'll see a good recovery. So, we recommend not selling on weakness, selling on strength, right ? Especially for those papers that seem to have broken through support levels. Don't sell on weakness, sell on strength. Sell on strength.
So sell stocks that look " broken" during a rebound, and there are many of these among AI companies . We have seen many support levels that these AI stocks have broken. Is the number on the S&P or not? Once upon a time, yes. Really? Because they never We probably hope we will never see the number 4 .
Do you think we will see a " four" on the S&P again? There are numbers we will never see again. I'm not willing to take any chances with predictions, but on number 6, I mean the support level below 7250, which is a Fibonacci retracement level, takes you back to the 7000 area. So it's not really that far, maybe 5 percent.
And if these sell signals are confirmed at the end of the month, that seems like a very realistic target for the downside. But right now we want to remain constructive in the short term because these extremes are really unusual and they affect internal market indicators like market sentiment. We saw the VIX index soar yesterday, reaching its peak on March 31 .
And that, of course, was the low for the S&P 500 index. What was that peak? I'm not exactly sure about the level, but it was within a day or two of each other. What was, what was, what was the VIX high recently? We just, we just hit about 20. I know, but did we hit 30 or 40 last year? Yes, yes, but that was before the March low was established, and not much time had passed then.
So we monitor this as a sentiment indicator, it's a kind of transaction indicator. We also keep an eye on things like the percentage of stocks above their 50-day moving averages, those types of market breadth indicators. And as you know, before we got this recovery, the breadth of the market really helped the rebound in those troubled sectors.
And we got it. It was very localized . Would you actually be surprised if we closed the year above 8,000? No, because I... So, it's possible. This is possible due to the potential for a sharp recovery in addition to positive seasonal factors, which become quite noticeable in late November and December.
This doesn't mean we're changing our forecasts, but with this culminating selling behavior, I would honestly have preferred a better close yesterday relative to the range of highs and lows. Maybe this means the rebound will be delayed by a day or two, to early next week, if you think about it. But once you see that good reversal day, it can have a significant short-term impact .
And we don't really have much time left until the end of the year at this point. And at least some of these market-impacting events are behind us. So some reduction in uncertainty could also help. So you don't, you don't expect something like that... In my life, I've seen bad Thursdays followed by a Friday that looked like the beginning of a rebound, but by the end of the day, it turned into something terrible.
You know, you don't think this will happen. You know, I wouldn't rule out more volatility in the next couple of days, but I think we're pretty close to a short-term low based on our metrics. We also have DeMark indicators that work for semiconductors, Intel, SanDisk. Yes. So I think we're getting pretty close to that short-term low.



댓글 0