저자: ThePortfolioBulletin진행자 · 외국인
요약 보기
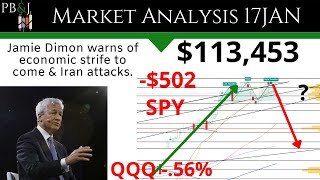
제이미 다이먼의 경기 경고(지정학 리스크, QT 등)와 이란의 중동 공격 확대를 짚고, 공포탐욕지수 하락·옵션 맥스페인(460)·주요 지수 차트를 근거로 단기 약세를 전망. SPY·QQQ·IWM 이중 고점 및 하락 추세, 유가·에너지 급락, 달러 강세, TLT 약세, 금리 상승, VIX 상승 흐름을 언급. 본인 포지션은 풋 헤지 및 콜 스프레드 중심.
다듬은 글
hi everyone today let's talk about what Jamie Diamond has to say about the 2024 and 25 economies then we'll talk about the Iranian strikes over the last 24 hours then we'll get into our usual data and charts then we'll finish up with my accounts for the day and my thoughts going into tomorrow's session if you like trading stocks and options and making money definitely like And subscribe I make videos like this every single day that the markets are open as well as Sunday so make sure you hit the Bell so you don't miss out on any future episodes welcome to the portfolio bulletin let's get started so Jamie Diamond warned of some powerful forces let's see exactly what those are and he did that during the world economic Forum in Davos and starting off here you can see he's talking about geopolitical risk so Ukraine activity in Israel the Red Sea quantitative tightening and any questions what exactly is quantitative tightening they describe it here as the FED reducing its balance sheet allowing those bonds to roll off and generally reducing the overall amount of money in the M2 Supply and then he mentions that the US economy has defied expectations everything has been looking quite well despite High inflation High interest rates and he says it's a mistake to assume that everything is hunky dory I don't know anybody who's used the term hunky dory in the last decade or so but here it is and he's saying that there's potentially some risk in markets and they also mention here this is not the first time he's warning of some economic downturns to come in 2022 he did mention a potential economic hurricane coming on the back of quantitative Titan and the Ukraine conflict so far that has not materialized but he is sounding the alarm once again there's risk out there and don't be lulled into complacency speaking of those risks we did have Iran broaden out this most recent conflict attacking Syria Iraq and Pakistan pretty interesting there over the last 24-hour period they have violated international law according to Iraq's foreign minister I'm pretty sure that's Universal them attacking their neighbor States obviously is not not good and the question is where does it go from now they've obviously been a Critic of Israel in the Israel Hamas War that's been going on recently they've been backing the houthis we talked about that recently as well they also attacked once again in the Red Sea hitting a US flag ship and we haven't really seen any retaliation from that either so the question is what happens now is Iraq going to retaliate Pakistan also has a significant military they could retaliate as well it's also interesting that they're attacking their fellow neighbor State versus the United States in the Red Sea so they're kind of expanding out this conflict in a way that doesn't seem to make very much sense they did mention that they thought the Targets in Northern Syria were the Islamic State not Syria itself and then Pakistan came out and strongly condemned the unprovoked violations of its airspace by Iran and said they killed two children and injured three more so not great there from Pakistan I think that's the most concerning Iraq a little bit less so Syria not so much but Pakistan I definitely think could have a strong response and the question is what is the United States going to do about this and its allies in the region and they mention here that they think this attack is isolating Iran and I would have to agree I think this is going to kind of close them off from the rest of the world attacking or neighbors is not a great way to do diplomacy and this continues to be an ongoing thing that could impact Global shipping lanes where about 33% of global Shipping goes through the Red Sea moving over to the fear and greed index look at that massive step down we saw today we were at 70 yesterday down to 58 today let's look at that timeline this has been rolling over we talked about it had a lower high setup here pulled back significantly now we have a lower low still an extreme greed on momentum strength though step down to Greed breadth stepping down to Greed put call ratio into fear volatility stepping up again here into fear talked about that breakout above the 50 moving average yesterday safe hav demand into fear so we're starting to see just a little little bit of weakness in markets I think there's a long way to go on this down move but we're definitely seeing it here on this indicator moving over to seasonality that was day 11 it was supposed to be a slight move up we ended up getting a dip down I think this is rolling into day 12 and 13 already expect another down day tomorrow in my opinion we'll take a closer look at that on the charts but weakness going into the options expiration moving over to the economic calendar Eurozone CPI numbers came in at expectations coron headline retail sales for the US core numbers came in better than expected headline numbers better than expected so retail sales us consumer continues to do well that was not enough to prop up markets we still fell throughout the session and that was pretty much it for the day let's look at tomorrow initial jobless claims Philly fed manufacturing crude as well as tips and fed balance sheet not a whole lot but fairly interesting and then looking at the Friday session existing home sales Michigan numbers which is pretty light for economic data moving over to Max painan down at 472 still drifting towards that 460 number for max pay for the end of the week total options 5.38 million tons and tons of options put call ratio 1.75 not a ton of puts relative to what we've been seeing but again 460 is your max pain 460 to 470 does make sense for a finish which should give you at least a couple of points of more downside before we get to that really major put wallet 460 so I don't think we'll break that level over the next few days but I do think we're going to head in that direction moving over to the charts we got another gap down and fall so that was expected based on my thesis here so we have a clear double top at this point we've pulled back pretty dramatically from that level on the Spy 477 46 was that level and we're all the way down at 47229 now touch my next level at 4780 you can see that here on the hourly chart bounced a little bit into the end of the session pretty strong volume there momentum slightly bullish on that move I wouldn't expect it to hold really and you can see it is down a little bit after hours not a lot but worth paying attention to and then momentum here on the daily chart step down towards bearish again RSI continuing to step more bearish makes sense this thesis is coming to fruition even with a little bit of an overthrow on that right shoulder if you want to look at it as a double top at this point that also works however you want to look at it this does look bearish to me even if we get a little bit of a short-term pop off of that 1 hour momentum moving over to the NASDAQ similar thesis much bigger down move much bigger pullback fairly interesting you can see that gap down through the trend line we'll go ahead and extend that out a little bit touched it pre-market broke down all the way to these lows at 40298 right around that 403 area bounced strongly pulled back touched the 144 touched that longer term trend line rallied up to the 21 slightly bullish momentum so a little bit stronger there on the NASDAQ but momentum you can see that first step towards bearish broke below the SMA on RSI big wick to the downside I would expect this to continue lower still watching this as a lower high setup and I would expect this to continue lower tomorrow right at that 21 EMA on the hourly chart broke down a little bit after hours and still looks weak just like the Spy moving over to the Russell and the Dow Russell down 71 dow.
25 gap down and fell ended up holding that 198 level after getting all the way towards these tops here let's go ahead and put a shortterm level at those previous tops I don't think it'll be super important but right in that area 18778 touch that bounced a little bit momentum bearish RSI bearish still looks weak to me then looking at the Dow gap down fell retested that level let's look at it on the hourly so big move down pre-market touched that level rejected from there I would expect that to remain bearish going into tomorrow's session could argue for a little bit of a double bottom which is interesting right at that 21 EMA potential for a little bit of bullishness let's see the hourly chart here see how that compares pretty interesting actually so we touched that shorter term support had a higher low setup and then potentially looking for a break there shorter time frame showing a little bit of bullishness but I would would be hesitant to jump in too aggressively there moving over to the equal weights on the hourly gap down move to that next level 15319 touch that bounced a little bit to the 9 EMA slight Step Up on momentum as well as volume pretty interesting looking at the daily chart though similar to everything else you had a lower high breakdown you have a new low here dogee you could always argue for a island reversal but realistically I would expect this to follow through bearish momentum bearish RSI going into tomorrow's session moving over to Apple and Tesla both of these were bearish on the day you can see those gaps lower big wick to the downside here on Apple down to 18032 took out this previous low ended up holding on the hourly chart and rallied up back above 18237 pretty interesting looking at the daily chart continues to hold that 200 SMA if it bottoms here you could argue slightly higher low from this previous low something worth watching there on Apple Tesla on the other hand we have a new low versus this previous low in yesterday's pre-market the Wicks here were the pre-market low on this 8:00 candle which is interesting and then we got back above 214 to end the session slightly bullish momentum let look at it on the daily chart this is an important level and it is holding got down to 212 something to watch there but 214 continues to hold after this pretty significant down move so if it holds here something to watch momentum and RSI are both bearish but critical level it did bounce and it is up a little bit after hours moving over to Staples and discretionary Staples continues to hold in the same region through a bunch of Wicks to the downside all the way down to 7212 it is below 7250 which is not great did test it and break down from that level so Staples showing a little bit of weakness at resistance discretionary is gapped lower tried to Rally mid session broke down even lower towards the end of the session before bouncing just like everything else got above the 90 ma little bit of volume a little bit of RSI let's look at it on the daily didn't quite get to that 55 EMA that's where I would expect to get to at least here in the short term 1713 on the daily chart it's down a little bit after hours Let's at this on the daily as well inside candle gap down and rallied like everything else 07 so still holding its value below the SMA slight bearish volume slight bearish momentum not great on Staples but still looks better than discretionary moving over to Oil and Gas and energy these had a terrible day gap down and fell energy held $127.99 after touching it here we expected some follow through after those big beer candles yes yesterday sure enough got it here so oil and gas critical level interesting bearish momentum bearish RSI energy gap through the level retested it and then broke back down momentum and RSI the same here this is a lower low versus the low in mid December so that doesn't look great either next support for me is all the way down at 7847 you can see last time we were in that area is going back to May of 23 so this has been a really strong move here for energy talked about it before but we were all the way up at 9280 pulling back now to these May lows in that 7847 area and then the actual Wick lows were down at 7637 so this could actually go quite a bit lower momentum and RSI like I said both bearish moving over to the 20 and 50-day averages these continue to Crater as we expected them to 20-day breath broke below 3660 next level is 16 it is oversold momentum bearish I would expect it to get to 16 at this point based on the price action we're seeing you can see that previous low here from 27 October and then looking at the 50-day average that is the biggest candle of downward price action we've seen in a very long time got below the 55 EMA at 7190 touched my level 6866 bounced a little bit if that breaks tomorrow 6225 and then you got the 144 and the 200 sitting down around that 56 area so something to watch 52 to 56 is your next price target for dynamic support and then momentum here and then RSI and momentum both quite bearish almost over sold on the RSI but could absolutely go lower moving over to yields both of these had a really strong move on yields popped up pretty well 2ear up to four and a third back into this consolidation 10e actually got Above This previous high up to 4.1 still looking at that 55 sitting at 4.19 interesting to see the two-year getting above the 9 and 21 EMAs bullish momentum bullish RSI on both of these and like I've been saying looking for that reversion does seem like it's coming here soon moving over to the put call ratio we did hit my first indicator here at 1.4 so quite a bit of puts in the market could be a temporary bottom something to watch did touch it quickly pulled right back to that one area see what happens this is something to watch 1.4 isn't super strong you can see we do hit it fairly regularly once we get to that two range that is very very high and that tends to be the bottom of markets at least in the short term and you can see going back to October of 22 September October the 1.4 area is what we were hitting and then that ended up being a really strong rally touch it again here in December of 22 and then had another pretty decent rally so something to watch it is a fairly important level and we did touch it today moving over to the dollar we did get another rally did touch my next level did reject from that level a little bit at 103.6 we're below the 921 EMAs bearish momentum on the hourly chart daily chart however continues to show bullish bullish momentum as well look at that dogee almost completely flat after touching the 200 and almost that 144 EMA and to me I would expect this to continue new higher maybe pulls back to the 55 on the hourly at 10317 that could be support but if it holds right here I would expect it to test and then potentially break out some more dollar strength does make sense to me with the bearishness that we're seeing in markets moving over to bonds J K gap down and fell TLT gap down and held pretty interesting right at that trend line it's between the two Trends here it's above that 144 momentum in RSI still bearish tenure continues to look strong I would expect TLT to go lower honestly I'm surprised it didn't fall more with the move we saw in yields but both of these continue to look weak to me moving over to volatility move index actually fell today pretty interesting vix on the other hand gapped up rallied got above that 1490 level for a little bit almost hit the 200 almost hit these trend lines then pulled back ended up closing below that level momentum bullish RSI bullish I think we need to actually go ahead and chart these here now does seem like we're starting to see a bit of a upward Channel we did almost get to the top of that we'll see if we get another one into this range here between 15 and 16 but the vixs continuing to show a little bit of strength going into tomorrow's session moving over to my accounts you can see I was down a few1 not terrible considering that the NASDAQ was down about half a percent I was down about a quarter of a percent even with my leverage so still doing fine there you can see these calls on those positions are all the way down at 399 and 396 for the next 3 weeks so still lots of protection you can see $15 and almost $14 on those positions still holding no issues and then looking at the WM still holding 16 days out should be able to roll that out here soon if I need to if we start to see a little bit of bullishness but I'm almost out of the money on that so just watching that one pretty closely XLE I did close that call that I had took the profits on that now I just have the protection from that call spread that's probably going to expire worthless trying to get rid of it but probably not going to happen and then I did pick up a tle q's here at 4750 for 49 I got almost all the profit on that probably should have taken it off at the end of the session and then look for a little bit more bearishness in tomorrow's session we'll see what happens early and see if I can reestablish that at a lower price for a bigger credit as I do expect more bearishness tomorrow moving over to my p&l graph you can see stock price all the way up here I don't start to lose money until we get at least below the call strikes on an expiration basis so plenty of protection and you can see my break even is all the way down here at 38360 or so so lots of protection even if I'm showing some short-term losses still trying to collect all of that money at expiration about $5,500 let me know down in the comment section what you think of Jamie Diamond or Iran's most recent escalations are those going to affect markets and if so how much do you think it's going to affect markets definitely interesting otherwise like And subscribe if you got any value out of this make sure you hit the Bell so you don't miss out on any future episodes of course none of this is financial advice this is all for entertainment purposes good luck in your trading and have a great day


Comments 0