
원문 보기
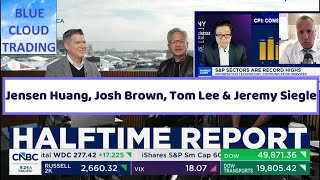
Blue cloud trades all night. Welcome everyone back to the channel. In a moment, I'll show you some CNBC clips, open up the charts, dive into technical analysis, and see if the price action confirms what the experts are saying. Subscribe if you haven't already , and we'll launch the first clip. Karl, thank you very much.
Welcome to Halftime Report. This is Scott Wapner. The main topic of this hour is the latest news on AI trading, as Meta and other key stocks are down today. Oil prices are rising, there is demand for bonds, we will discuss all this with the investment committee. With me in the Post 9 studio today: Josh Brown, Rob Sechan, Malcolm Ethridge.
Let's move on to the markets. The Dow didn't fall much. The Nasdaq apparently fell over 500 points. You can see why we have almost a 2% drop there. Speaking of these AI actions. But before you look at the Dow and say, "Well, we didn't fall that far." I mean, look who's leading: essential goods, healthcare, utilities.
The top three sectors today, that largely determines how defensive this market seems lately. However, Meta's negative price dynamics are somewhat telling, and the question is why this is happening when they are raising the mid-end of their cost range. You did n't really get much information regarding 2027.
Free cash flow is negative, Wall Street doesn't expect a return on this until 2029. Cost growth is outpacing sales growth. When will this reach equilibrium or change? Operating margin is falling. All of these key issues explain why stocks have fallen. You covered this quite recently on Best Stocks. Yes.
Mr. Sechan owns this asset. So, I think there will be a capital shortage, but not for Meta. And I believe that the main thing here has not changed and is unlikely to change—the demand for AI. The demand side doesn't care who builds the data center. What's exciting about the demand side is that I've now made these technologies central to running my business.
I need access. I need this to work, and you figure out which data center to direct my workloads to. I really don't care. I have a contract for the enterprise version of Claude, or I work with OpenAI, or Gemini, or all of those, or I implement my own models with open weights into my Snowflake environment.
I don't care which data center processes these workloads. This is a job for the technical department. As a business owner, as a business, I'm interested in making this work, and until that demand goes away, we need to focus on who is entitled to the profits. The developer who can build these facilities with the lowest cost and as quickly as possible will receive the right to profits .
So, we know that SpaceX will win. They are perhaps the best builders in the industry. It remains an open question whether Oracle can win. The question remains whether Google Cloud will be better than AWS. These are questions that are more interesting now than just the growth of all indicators. I think, in the case of Meta, they have a trump card up their sleeve.
They can play this card at any time. Look at the recognition SpaceX received this week for saying, "We're going to build 10 gigawatts." They receive about $20 billion per gigawatt of contracted revenue. They can probably build faster than anyone, but Meta has already built quite a few. They have contracts for further construction , and anytime they feel the need, they can say, “You know what?
We are also in the cloud computing business.” And they are going to And how will stocks react to this news? They will jump 75 points. It seems like the issue of access to capital is starting to show up in many stories and is almost hanging over the entire sector. For example, CoreWeave. Mm. This is one of the issues that is of concern regarding this company.
And if you listen to what Jensen Huang told CNBC in Berlin, he talks about the same problem. Listen. The demand for neo-clouds is skyrocketing. Their capabilities are extraordinary. So, what is lacking is only working capital to fuel and finance this growth. And because there is huge demand in many AI sectors, there is a shortage of capital.
The demand for capital far exceeds its availability. This will be resolved. OK. Want more? Blackstone's John Gray was on the air this morning. Speaking of CoreWeave, I quote: “Their challenge is , do they have the capital, debt, and equity to execute?” It seems to me that more and more people are talking about this problem.
And what happens if capital becomes harder to raise? And then you will have to attract it in conditions when interest rates are rising. They've fallen a bit now, obviously , but, despite everything, the environment is the environment. How much of a potential problem is this for this deal? I'll go further and ask: what happens when we have to give up some of these commitments?
Who will be left with nothing, huh? If capital is lacking, it effectively means that Facebook will have to break its promise to someone. Anthropic will have to break a promise to someone, and so on, and so on. So the question is, who will actually be left in the lurch? Who is building all this ? You saw how Microsoft, for example, backed out of a data center project in Europe, where Neocloud was now left with nothing.
This also applies to the issue around CoreWeave . We've also seen... I wish I could share your enthusiasm for Meta , but we're seeing a zero- tolerance policy for companies, hyperscalers, that are becoming cash flow-loss. And that's essentially what we heard during the last earnings call, which I think is reflected in the share price that we're seeing.
Zero tolerance. Shares fell 5%. Zero tolerance...Well, we still don't know why they pushed the earnings report back earlier, do we? So, I think there is...You've given us the known facts, right? All the positive aspects of why we would want to own them. Unknown unknowns still remain: what is the reason for the earnings report being moved a week earlier than usual in a long time?
It is assumed that this is due to the issuance of debt obligations, which they wanted to carry out after the story had already spread. We'll find out if there's really a willingness to buy anything from Meta in the fixed income market. I think you're right, at least in terms of direction, but given this Class C share project, they're more likely to want to raise capital through equity rather than debt , but the effect will be the same.
I...So, I agree, I agree with you on that. You'll probably have to do both. I think because they actually said they were putting all their chips in the center of the table in this AI game; Muse should now be on par with the leading models because we have made so many improvements that corporations should choose us over Anthropic or OpenAI.
We'll find out if this bet pays off, but they're betting everything. I'm just, I'm just wondering in a way whether the issues around CoreWeave and this comment from Meta that we're discussing right now will eventually become, or maybe these are just the first signs of what's putting pressure on this trade.
I mean, if you look at what stocks do, this story has always been about capital, right ? The promise to spend it, the ability to earn it, and the profit from it. Mhm. And can I ask you a question? do all three of these things need to continue working? Staying with the Meta example to answer this question.
be specific to Meta only. Actually, no. that's all...That's But to answer that question, which two public companies have made the most money using AI? In terms of return on investment (ROI), who are number one and two? These are Meta and Google. Yes. I don't even know who number three is. These are Meta and Google.
Well, that's why Jensen Huang told us—and I've said this a million times—a few days before the Super Bowl, when we sat down with him, that nobody does AI like Meta. So I think there will be a period of normalization. And these companies will still grow above the market rate. They have been overvalued to the point where they are trading at perhaps a 9% premium today.
I don't even know what it is in relation to the S&P, but it has definitely declined significantly. And that's a reflection of the rates, the difficulty in raising capital, and the fact that Meta has a different class of shares that they're going to use to issue capital. So when you get to a period of normalization or a steady state, you look at the investment universe and say, " Okay, do I want to own this growth at this price?" And you will see the alignment, and it will not be zero.
You will look at this relative to other sectors that you can invest in. And I'm sure that when all this is sorted out— right now we're just focused on the second derivative, the change in the rate of change. This is always the first step. That's what caused it. We see a change in the pace of change in the future in terms of profits, margins and financing opportunities.
Now that it's getting back to normal—I don't know exactly when that will happen—but when it does, I want to be here. Let's talk about semiconductors, because I think it's a critically important topic to discuss. And that brings me to what you mean . Lamb Research, I mean, first of all, the stock is down about 25-27% from its peak.
Here's a stock that fell almost 10%—Lamb Research, LRCX. One only has to mention DRAM, which itself is in a state of significant decline. This is about 40 or so percent below the maximum. What was the problem with Lamb? The forecast was only slightly higher than expected, demand is stable, but supply is a problem.
As we have heard from many other semiconductor companies. I think Barron's summed it up well. Good enough. Just not good enough. Which problem would you choose? As a shareholder in a business, you may have one of two problems. Insufficient demand, causing you to lose revenue because people don't need your product, or demand so high that you can't meet it and hit your targets.
Which problem would you choose? Well, of course. I mean, that's a rhetorical question. Of course. Therefore, the shares receive, so to speak, a "punishment" of 9 % after these results, rather than the 20% we have seen in companies that actually failed to make profits due to lack of demand. 20 % or even more over the last few reporting seasons.
Applied and KLA-Tencor also fall on this backdrop . This is a nice drop, and the entire semiconductor complex, whose shares we hold in large numbers, is now declining. But let's not forget that these stocks are still up significantly over the year , significantly outperforming the market. So the results are ultimately excellent, and even at Lamb, revenue was at a record high and earnings per share (EPS) grew 74% year-over-year.
These are epic numbers. They reflect macroeconomic concerns, and there is no doubt that the market is currently risk averse, even though we are expanding, which is usually a healthy indicator. You said it yourself at the beginning of the program. We are expanding into utilities, healthcare, all defensive assets.
Yes, I think that's the mood right now, but that doesn't mean we should get rid of these investments, because if you look at the fundamentals, eventually we will reach equilibrium and revalue everything. Procter is having its best day in six and a half years to give you an idea of how defensive the mood has become.
So, Cerebras, you bought some more. Yes, I'm swimming against the current a bit on this issue. So this is probably the most speculative asset that I personally own, but I also see this as an opportunity to own shares of a chipmaker that I think was worth 180 on October 1st and is down to about 110 today .
They've been sold off a lot. They are down 37% this month and, as you noted, 71% from their peak. So, many are concerned that their revenues are now tied to just one company—OpenAI. So as more and more doubts arise around OpenAI, of course, more doubts arise about whether any company that supplies it will have the money to spend with them.
But I think there is an opportunity here, as Cerebras has already proven that it helps solve the latency problem that exists inside data centers and chipsets. And this is very useful for companies that are currently working in the area of agent management , or cybersecurity companies that are building autonomous agents to combat attacks, where latency can be a silent killer that decides whether you can solve a problem or not.
So I think their ability to bring in more partners than just CrowdStrike, which is their only partner right now , and the ability to bring in additional partners and customers in the cybersecurity space—that's where they have a huge TAM. So that's my bet that this company, which has been hit hard, as you just said, has a chance to turn things around for the better.
I liked this company when it was priced at 175-180, so now , with a discount, I like it even more. When do they report? They also report at the end of the month. At the end of this month. Good. Question? Comments? Complaints? None. I mean, I wonder if there's any desire to invest in stocks that have fallen 71% from their peak.
And if you like them, it's impossible to guess the time perfectly. It makes sense to go a little against the current. I guess I'm assuming you're not opening a full position. You are likely to buy in small portions. Well, actually, this is me adding to what was already a full position because it has rolled back so significantly.
I just saw an opportunity to buy at a discount. OK. So, let's talk about IBM. Um, I mean, maybe you could argue, I know, it sounds a little crazy, but maybe you could say that they have the most to prove right now in the history of artificial intelligence. Why do I say that? Because remember what happened after the earnings report last time in the second quarter?
Let's look at the dynamics since the beginning of the year, and you will see this gap. It was a cliff jump, right? They reported that it was actually like a pre-announcement . They shocked everyone. But why does it look like Batman? The stock fell about 25% that day. It was the worst day in history.
Expectations changed dramatically after that point. Last night they exceeded forecasts and raised their plans. But under these circumstances, with this schedule and after those results, this is not enough to significantly raise the stock. Even if they have a pretty good story. And Arvind Krishna has it.
And everyone liked this story. At least until that earnings report. You own these shares. Yes. And last night they exceeded expectations. These are actions that obviously didn't work. They are a little more expensive than when we bought them. We came in when the indicator was around 12. You know, I think we're being patient with them.
You know, they still need to prove that they can use AI and not suffer from its interference, and I just do n't think they've achieved that yet. There was evidence this quarter that they can work effectively with this, but I think more needs to be proven . But today your targets were raised six times.
So, there is still faith in the company. You sold them in July. M-hm. Please return the schedule from the beginning of the year to the screen. You sold them after they fell off the cliff, right? So, I think IBM is a perfect example to answer your previous question differently. So the question is: what if we run out of money, or what happens when we run out of it?
I think we're asking the question from the perspective of the companies that are building, will they be able to raise capital to start work, build more data centers, buy more chips, etc. The other side of this equation, which we have n't talked about at all, and which is just absurd, is what happens when the companies that buy these products refuse to spend money on them .
Like you, I know you talk to CFOs regularly, as do I. They walk with their heads held high more than before, in the sense that they have finally taken control of corporate budgets and have been able to order people to stop implementing AI into the system at all costs and to really limit the use of tokens .
JP Morgan said they are abandoning advanced models in favor of more open ones. They are looking for the cheapest solution. What you have to do is find the cheapest solution. There was an article recently in Business Insider that quoted a JP Morgan executive saying that they had employees who spent more than their annual salary on tokens, which they found absurd.
When these companies find ways, find alternatives, to stop this level of computing, I interviewed an AT&T executive about how this company did just that. So we move away from experiments. We are now talking about implementing it in a smart, responsible way, and this cost reduction also raises the question of whether all the costs incurred by hyperscalers will be repaid.
This is the reason why Nebius, CoreWeave, and others are getting hit. Well, there are many questions, and we are eager for answers. And we'll probably have to be a little more patient before we can get all those answers as this story continues to unfold. Let's take a break, okay? When we return, we will have a downgrade for Netflix.
Stocks fell sharply yesterday after the earnings report. We'll see what the committee thinks about this company today, and we'll also have a new name on the list of the best stocks on the market from Josh Brown. Moving on to our Julia Burstyn. She has news about Elon Musk and Skydance. Julie. So, Skydance shares are now down 3% amid reports that Elon Musk has invested about $1 billion in Skydance.
This report is from Semaphore. Trading in Skydance shares has now been halted due to volatility. They resumed trading and are now down 3.2%. We've reached out to Skydance, as well as Musk, for comment, but have yet to hear back . But Elon Musk was talked about as one of those whom David Ellison considered as a potential investor in this company.
Skydance shares are currently trading below $8. So they fell quite significantly after that deal was completed . We'll get back to you. Okay, Julie. Thanks for this update. We will continue to monitor this. Well, let's keep an eye on Spotify's stock as it reaches 306 million paid subscribers. This exceeded predictions.
That was enough to convince Josh Brown to increase his stake by about 30%. Yes, I didn't have a great position. So I like to add to the growth as confirmation that I'm on the right track. Usually when I own stocks for trading, it's a small volume. But what they said, their outlook for the future, I think, has strengthened my confidence, and it's raising the average price, so it's a little easier to do.
They actually provided a revenue growth rate of 14%. They reported that gross margin was 33%, up from last year. The number of monthly active users increased by 11% year-over-year. They now have 788 million active users, not just those who have registered, but those who use the service. Forecast—818 million monthly active users and 316 million premium users , which will add another 10 million paid subscribers.
So the business is doing great, and you know, the stock has been tied to Netflix for a while. If you look at how they traded together, they went up and down almost simultaneously on the same days. These seem to be breaking away from Netflix , because frankly, they just work better, and it's a completely different...That's it.
So this is a completely different situation. So I think there's a lot of room for growth here. Previously, stocks were much more expensive than today, with worse results. So I actually think there's a lot of potential in this movement. OK. Growth of almost 9%. SPOT is... let's talk about Netflix. Since you mentioned them, we'll move on to them.
Today, Wolf downgraded the rating from "above market" to "at market." Stocks are obviously going through a difficult period. It was a difficult period, to say the least . So today the stock is up 3%. Now look at the big picture. Tell a real story. Because they fell sharply after the earnings report, and the long-term trajectory of this company has been terrible.
If you own them, you know about it. That's it . Wolf says, “ Engagement has not responded to the increase in investment , and the changes in content leadership last week have convinced us that solutions require patience and lower margins.” Everyone has them. You have already reduced your position. Yes.
Is n't that right? Yes. What are you guys doing? We are holding it now. However, quarterly figures in line with expectations and a weaker outlook will not help change the situation with these stocks in the short term. I think they have a lot of opportunities ahead of them. They are currently showing weaker growth than they have in a long time, and frankly, I have a feeling that at some point this year they will be a candidate for a tax loss harvesting sale.
Yes, I defended this company for quite a long time because I thought—and partly still think—that it couldn't get any worse . As if the situation couldn't get any worse than it is now . The ratings have already been lowered. Ratings are still down. The only thing in the reporting that I didn't like at all and makes me doubt the stock's quick recovery is the drop in advertising sales figures.
This was one of those moments that we felt very positive about Netflix. They found a way to enter the advertising market and did a great job of it, even though the company was extremely reluctant to do so for so long. But the fact that this figure is falling does not bode well for the company's future prospects, at least in the near future.
You are right. Weaker engagement will, of course, lead to disappointing advertising sales figures. Well, you can't raise your ad sales bids or insert more ads if engagement is dropping. And you are 100% right. I think this is a big risk on top of all the other problems. Okay, let's talk about CrowdStrike .
The target price is raised to 275. It was at 250. This is an “outperform ” rating from Mizuho. Say something about it. Uh, these are the best stocks in the world. I've held this opinion for 6 years now, and it doesn't change with the seasons. I can't imagine all these trillions of dollars in spending on AI not being accompanied by increasingly strong use of cybersecurity.
Malcolm thinks I made it up . It's like it's not even a real company. IQVIA. It's in my fictional stock portfolio. What ticker? I swear to God, this company is real. Ticker—IQV. This is actually one of the best parts of the research that Sean and I do on the best stocks in the market. It forces us to look beyond Meta, Microsoft, and other companies that we otherwise wouldn't even pay attention to.
This is not a gigantic market capitalization. It seems like 25 or 26 billion. But the company has been around since 1954, Malcolm. And I wasn't there yet, well, I wasn't there yet . Me neither. IQVIA is a company hired by drug manufacturers to help conduct clinical trials, but more importantly, track sales of their drugs.
They own one of the most important, if not the most important, private healthcare datasets in the world. Like many information companies, its shares slumped significantly earlier this year. Look here. During the "SaaS apocalypse," when people thought MSCI, Morningstar, and all these data companies would become irrelevant in the age of AI .
And then, a few months later, everyone realized, "Oh, wait, that's not how it works at all." Data is becoming more important than ever. And that's exactly what's happening here. So, the second quarter results were announced: they exceeded expectations for revenue and profits. Adjusted profit increased by 12%.
More importantly, R& D orders have increased by almost 20%, signaling that this company is poised to become a leader in AI-powered drug development . That's why stocks are rising. On the chart, we see higher highs as well as higher lows. The stock has gone from around 155 in the spring to its current price.
At CNBC Pro, we have all the levels that both traders and investors should pay attention to. I was really interested in writing about this because I think this is the first time we're drawing people's attention to them. Thanks for the recommendation Pro. Again, the best stocks on the market according to Josh Brown.
Be sure to take a look. By the way, the healthcare sector has again hit an all-time high today. This underscores what we talked about at the very beginning of our program. Healthcare, essential goods, utilities—the three best sectors. You have a lot of assets in healthcare, right? AbbVie, Amgen, Gilead, J&J, Lilly.
We are significantly overloaded in this sector. I think it benefits enormously from many long-term trends in pharmacology, but there is also a future advantage that we will see from the use of superintelligence. I think this will be one of the main beneficiaries. What's really interesting is that at the beginning of the year we were able to make good money on growth strategies due to the dominance of core AI infrastructure stocks in the portfolio, and now healthcare—our other significant holding in the portfolio—has taken over.
We remain optimistic about each company we own. Well, you know, whether it's AbbVie with their Skyrizi and Rinvoq. And our friend, our mutual friend Adam Parker had something published, I think, last weekend, about how healthcare, out of the 11 S&P sectors, was one of the slowest in terms of hearing from CEOs that we're beating our forecasts because of some kind of, um, AI and growth going forward.
But yeah, looking to the future, this is a sector where if investors start hearing about the accelerated, um, use of data and all the things that AI is doing for others, I think that's a good sign for a lot of companies in this sector. Do you like this direction? Well , I like this direction. I'm starting to feel favorable towards this sector, considering what these guys are talking about.
I think this is one of the most obvious places where the AI adoption phase is really starting to make waves. I think finance is an obvious component, and I think healthcare is an obvious one : healthcare, pharmaceuticals, biotechnology, particularly in accelerating drug delivery to market. These all look like great places to invest, but I also want to do my homework and make sure I know the places that are most likely to benefit the most.
Let's take a break. We will be back. We will be back. Um, we're back. Houston, we don't have any more problems. We are back. Can you hear me? Options Action, Oliver Renick in Chicago with Cboe Global Markets, was it yesterday or the day before yesterday that you were looking at KWEB ? So, today we remain at the global level.
That's right, Scott. And, as I mentioned at the time, buyers of call options on KWEB suffered losses throughout the decline. It's the same again today, but what's fascinating is that despite everything that's happening in the market today, the most interesting options action is actually being seen in international market ETFs.
Judging by the unusual trading volume, it's not just KWEB, but especially EWZ, a Brazilian fund. Both of them have fallen, but traders are apparently seeing the pullbacks as an opportunity to buy on the dip. KWEB trading volume is double the 30- day average: 64,000 calls versus only 10,000 puts. There are a lot of call option sales, but also very few put option buyers.
But EWZ is still something worth keeping a close eye on. It has had a great growth period and the options performance is simply amazing. Over a million contracts were traded this morning, and about 80% of them are call options, with volume eight times the 30-day average. And listen, the most popular contracts to buy in EWZ by a wide margin are call options with strike prices of 43, 46, and 48, which expire on December 18.
This strike 48— is the cheapest, it is the most distant, but had the most volume and needs a 17% rally to break even. Oliver, thank you. Oliver Roenick, see you this afternoon. You still have Baba, right? Yes, there is. We bought it on December 23rd. She is still in the black by 50%. Sure, she gave a lot back, but it's still plus 50%.
Um, they suffer from the same capital intensity issues that we see across the sector. They have a cloud business and a dominant e- commerce business. So, whether they will be able to monetize these things is a question that remains relevant for everyone. Here's the thing: the assessment here is much more acceptable.
Okay, next on the plan—settings . It's now 9:00 a.m. to noon. Welcome to Squawk on the Street. What is moving? This is incredible. What happened? We're getting breaking news from the Fed. The most important guests, market dynamics. Unattractive price dynamics in some of these titles. Meta is at daily lows, down 7.5%.
SpaceX loses 7%. AMD, Micron, Hynix, Marvell. What about energy companies in the field of AI? Fornova minus 11. Vistra, almost 10. What do you think about that? Well, if you're at the tail end of the train, you're companies supplying components or building facilities, counting on ever-increasing capital expenditures as far as the eye can see.
Yes, Meta confirmed its capital expenditure expectations. It is noteworthy that she did not raise the rates. This is the first quarter in a long time where we can say that. And we still haven't heard from Alphabet, which may or may not do the same. Now they have cover. So, now we can say: yes, we are just as optimistic and aggressive, we are just narrowing the range.
And that's not the same as increasing projected capital expenditures next year by 20 billion, which has been the trend for, I don't know, 12 quarters. I think it was a losing proposition because if you increased expectations for capital spending, it would mean raising more debt capital, which the market clearly doesn't have.
I think you're right. So, this wouldn't be a good outcome anyway. So it wouldn't matter. You But I think this leads to the conundrum, if you will, that we started our show with. Going back to the beginning, you need to decide where to get the capital. Balance sheet , debt market or elsewhere? Um, issuing new shares, I mean, all these decisions that are being made are a different type of decision based on a number of factors that have now entered the market, right?
100%, and I think the market will eventually find equilibrium and digest this. And when you talk to any private equity funds, when you talk to investment banks, they say that companies that need it and that have the right contracts will get the funding and be able to support that growth. I think Josh has it right .
We live in a world of haves and have-nots . Yes, Meta is not Coreweave. Right. Coreweave is not Meta. Especially when it comes to when part of this debt is due to be repaid. The conditions for companies like Coreweave are extremely different. Much shorter timeframes compared to some others, like hyperscalers, where this is stretched over a much longer period, years if not decades.
If you read the S1 form that, um, came out this week, the revised S1 for Anthropic, you get a very quick sense of the scale just by putting together all these commitments. And that means that whether you use a computer or not, you have to follow these agreements. This, this is like hundreds of billions of dollars of commitment that will go to Google Cloud, to Amazon , and so on.
The more important thing that needs to happen: SpaceX needs to continue delivering at the same rate and talk about ramping up computing power; component suppliers need it, energy companies need to hear it, and then Anthropic needs this IPO, and it needs to get off to a good start. And I think if those two things happen, these stocks won't be blood red day after day.
But they need, they need that ongoing confidence now, which I think is a different environment than the one we were in this summer. Looking at some banks as well. I mean, there's been a thought lately that they might have woken up. Earnings reports are already behind us. The trends for these stocks have started to look a little better, not just over the past few days, but I think recently as well.
Um, you know, they're obviously in the red zone today. JPM in the red. Goldman fell 1 and 2/3 percent. Citi in red. Morgan in red. Uh, BofA and Wells are not, uh, they're just modest, uh, they're having a small increase. What do we think about these shares? You will receive your American Express statement tomorrow.
Uh, people will be watching this closely, not just for consumer signals, but of course for business spending as well . So, I think this is an important event. Their revenue for the quarter is expected to be 20 billion, which would be 9% more than last year. They can do it, and as always, it looks good on our part as a consumer.
High- level consumer. Of course. But two days ago we got the Capital One report, and it was a great report too. So if you get what I think you're going to get from AXP, this rally in the financial sector could continue. Some of the names are tied to, you know, markets and cryptocurrencies. Robinhood.
A drop of 5 and a half percent. Uh, Coinbase, down almost 5%. So, you know, it's pretty big. And again , SLAM Research, as we discussed earlier. Good enough? Maybe not good enough. And that's why stocks are falling, dragging down much else in the sector. Uh, let's move on to the final agreements. A good warm-up.
Good team. Until these final agreements. I like this warm-up. This is my first rodeo, right? This is n't my first rodeo, cowboy. OK. What do you have? Er, Zscaler. ServiceNow. Spotify, beast mode. Nice to see. OK. So see you at 3:00. Dan Greenhouse, Ed Yardeni. Uh , we'll discuss all this, of course.
We will get straight to the closing of the auction. OK. Welcome back. Another check of the markets. The Nasdaq is falling, as you know, the Dow , uh, is now down more than 6% from its all-time high set earlier this month. Our next guest sees opportunities in this sale. With me now is Tom Lee from Fundstrat.
He is also a CNBC contributor. Nice to see you again. You say that concerns about AI prevent AI from becoming a " bubble." Some suggest that these fears are merely “ bursting” what has already become a “bubble.” Oh my god, I know there will be two sides to this discussion . But the reason I say that concerns about AI are preventing a " bubble" is because we continue to see amazing discoveries made by AI.
I mean, whether it's Muse and agents, or maybe two weeks ago OpenAI solved 770 math problems. This is not the end or late stage for AI discoveries , nor is it even the peak of performance. So, as long as we see progress there, every dollar of capital invested in AI is generating a return. I think it's very healthy that debt markets are, to some extent, curbing the uncontrolled speculative boom around AI.
So I think this is a very healthy correction. So you're focused more on the derivative implications, you might say, than on concerns about costs, funding, or capital crunch? Yes, unfortunately, AI really does require huge amounts of money. We produced a report a few weeks ago that shows that 30 trillion will be spent on AI over the next 25 years.
First, there are plenty of investment dollars , as annual interest income from US households alone is about $7 trillion. So, you know, a trillion of that can be covered just by the percentage income of Americans. But the construction of mobile networks cost about 25 trillion, and highways cost 25 trillion.
I consider AI a more important infrastructure building than mobile networks, and the amounts are about the same. So I don't think there's too much money being poured into AI today . Would you buy on the dip already? Yes. I think we're in the final stages of a sell-off, because it's become the consensus " short" to play against the technology sector, and bond yields, which have been so frightening to the markets, as you know, have gone down.
So you have two factors that used to be obstacles: the Fed was quite hawkish, and now it's becoming quite dovish. And interest rates, which were approaching 5% and scared people with the possibility of 6%, are now below 5% again. Perhaps the only problems now are closed debt markets and, of course, uncertainty due to the war.
If you say "yes, I would buy," what exactly would you buy? Would you stick with just the biggest AI-related stocks on the market? Yes. Scott, I think AI, memory bottlenecks, Nvidia, and the G7—they're selling off because it's easy to play bearish right now, and I think, of course, people are worried about the credit aspect.
I think they are bottoming out , but I also like software and cryptocurrencies. I would say I'm pretty bullish on the whole cyclical trade, and as you know, the financial sector hasn't been growing, but rates are falling. So, I think there are a lot of opportunities. This is what I view as a compressed spring of strength as fundamentals hold .
Oho. So if you look at, say, the semiconductor index or the DRAM ETF, we show it. Hmm, there's so much destruction in this trade . I'm just wondering what story this graph will actually tell over the coming weeks, if not months. Scott, this just shows what a battle artificial intelligence is today. But keep in mind that in 1997, 3 years after the launch of the public internet and browsers, Cisco, which was the biggest stock at the time, had a huge 50% drop.
Partly because Alan Greenspan talked about irrational exuberance and later hinted at preemptive rate hikes, which is very similar to today. Cisco went through a 50% correction, fell to five, and a year later it was 18. I think the situation is similar. You know, ChatGPT is actually celebrating its third anniversary.
I think we're at such an early stage in AI commerce, but people's excitement is understandable. Many have made money, and there is also significant profit-taking happening now. What about other areas of the market? Yes, the market has expanded, but, you know, not in the best way. Healthcare, essential goods, utilities— this doesn't exactly add confidence to the market.
Yes, the fact that Waste Services, an extremely defensive group, is rising shows that the market is nervous. I would say the optimistic argument is that it is also an argument about the breadth of the market. But I talked to Mark Newton. It looks like we're seeing the tech sector actually touch base.
So, I think we understand that the next few weeks will be a period of uncertainty leading up to the midterm elections. I think this is a window of opportunity for investors as the market is generally risk averse, but I think the market will rise broadly and very strongly after the election. We had Mark on the air yesterday or the day before yesterday, he said that underneath the surface, the QQQ and S&P indices are stronger than they appear.
So, we'll see. Tom, thank you. Tom Lee. Next up is the countdown to Western Digital's earnings report. Hello everyone. Welcome to Blue Collar Trading . I am George. Today is Thursday, October 22nd, and I'm writing this after 5:30 PM Eastern Time. We just saw clips from “Halftime Report” with Josh Brown, as well as Tom Lee on “Closing Bell” in the last segment.
So now we will look at stocks and ETFs, not all, but a significant portion of those discussed, including oil, SPY, QQQ , Dow Jones, Russell, European stocks, gold, and silver. The VIX jumped significantly, rising by 14.6%. We will also look at Bitcoin and Ethereum. We'll look at about 34 stocks and ETFs that I've listed here.
These first four, just four out of 34, meet the criteria I personally look for before even considering adding a stock to my portfolio. So I'll explain exactly how I came to this conclusion. And before we get started, let's take a look at the markets. So, the S&P 500, as you can see, opened with a downward gap in the morning and remained at that level.
It fell by 1.21% per day. The Nasdaq opened with a gap down and continued its decline of 2.6%. The Dow Jones also opened with a gap down, hit a low around 10:30 a.m., and then started to rise, closing with a small gain of 0.02%, while the Russell 2000 also closed with a gain of 0.07% on the day. Let's stay on the heat map.
These are individual stocks within the S &P 500 by market cap, and you see Nvidia, a lot of technology companies like semiconductor manufacturers, they're all in the red . Apple has grown. Software stocks performed quite well, such as CRM, ADP, Uber, Swift, and Adobe. Google and Meta both fell. Look at Meta, it fell 6.98%.
Amazon fell, Tesla fell. Financial stocks performed quite well, well, not all of them, but most of them. The consumer staples sector has done very well. Public utilities showed excellent results today. Basic materials, real estate and industrials showed mixed results. Healthcare actually performed quite well.
So let's look at the groups, and that will show us the percentage changes for today for each sector. Oh. Let me zoom in a little bit here. That's it . As you can see, consumer staples rose 3.13 % today, right? Next come utilities, real estate, healthcare, and finance. The technology sector is at the bottom, down 3.23%.
Weekly dynamics: consumer staples at the top, up 3.55%. By the way, friends, if you follow my videos, the ones for subscribers only, you would already know that this is one of the sectors worth investing in. I've been talking about this for the past few weeks. A consumer protection sector is what is needed.
Utilities, healthcare, finance, energy, real estate—all are in the black . Communication services have declined. The technology sector fell 3.3% for the week. In monthly terms, the consumer discretionary sector leads with a 9.11% increase, followed by utilities, energy, healthcare, and technology; Basic materials and communication services are clearly lagging behind, okay?
So, let's start with the fact that the Oil ETF (OIH) still has a blue flag. This essentially reflects the strength of the trend, the Ichimoku trend, guys. We use the Ichimoku indicator. It is very simple. I know it might look a little complicated because there are a lot of lines. There are five lines in Ichimoku.
Of course? These are actually five moving averages. What we have here is a nine-period line. This is the middle of the last nine periods. It is called Tenkan-sen. Of course? Next is the 26th period line. This is the midpoint of the last 26 periods, not the closing price. Notice how it aligns. This is very different from traditional moving averages.
So, we need the green line to be above the red line, that is, the nine-period line above the 26-period line . That's good. We want the price to be above both of these moving averages. Then there is the Ichimoku cloud itself , which is actually formed by taking the middle of these two moving averages, the Tenkan-sen.
Oh, these are the green and red lines projecting this middle 26 periods into the future. This is called Senkou Span A. And Senkou Span B is the middle of the last 52 periods, in this case 52 days. Instead of projecting it below or above the candle, it is projected 26 periods into the future. This is what creates the cloud.
Very unique . And this is a Japanese indicator. It was actually created or started in the late 1930s , and then published in the late 1960s. And then it was brought to the US and the West in the 80s, I think that's when a lot of financial institutions started accepting it. And we have one last line, guys , and that's the Chikou Span or the lag line, that white line you see right there.
This is the current price. And it's simply projected 26 periods into the past as a line. And what we're looking for, you know, is to see where this white line is relative to the candle 26 periods ago. If the white line is higher, it is a very bullish signal. If it's lower, like here, it's a " bearish" signal.
True? And remember, you won't see the end of the line until you look at the current price, and then you'll always see the 26 that's lagging behind in the background, and those in the future. So, this actually takes into account the past, the future, and the present, okay? And this shows us the strength of the trend.
And as you can see , we have a series of what? Higher highs and higher lows, right? You can see it there. Oh, okay. Higher highs here. And the cloud reflects this. So we want the price to always be above this cloud when we consider entering a long position, well, a buy entry. Um, negative things happen when the price drops below the cloud.
I also have the 200-day moving average overlaid right here, and it's also in a nice uptrend. We have the directional movement index, the green line there—that's the positive DI 9. It's above the negative DI 9. The ADX—that's the white line you see right there. You want it to move upwards. It is currently moving sideways, which means there is currently no momentum for oil.
As you can see here, the price has slowed down a bit. But the trend is still strong. When the red line is above the green line, it is negative. Okay, if you look here. You see how it led to a drop right there while the red line was above the green line. Um, and when the green line crosses the red line from bottom to top, that's usually a more bullish signal, okay?
So, let's continue. Let's take a look at the rest of them. This is a weekly schedule, and this is a daily schedule. Here is the weekly schedule. We see that all this happens on both time intervals. That's why it gets a blue flag. With everything else, something is wrong either on the weekly or daily schedule.
So, let's look at the weekly chart for SPY. As you can see here, we're currently below the nine-period moving average, guys. This is not good. We were a little above it before , for example, yesterday, but today it fell lower. Look at the daily schedule. We are also below two moving averages. So, SPY fell 1.18%.
Yesterday he seemed quite optimistic. But, you know, we still got a certain signal here. The red line , an index of the direction of movement, did not confirm this. See how the red line was above the green line? Here. So yes, this is not good. And the question is what happens next. At least it finds support right on the cloud.
So, technically we have a weak uptrend for SPY on the daily chart and a weak uptrend on the weekly chart as the price is currently below the nine-period moving average. The QQQ ETF, here it is on the weekly chart. It looks like it's been below the nine-period line for the second week, and now it's even below the 26- period line.
But tomorrow is another day, right? On Friday, we will know exactly where this candle will stop. It is still in the process of formation. This is a dynamic candle. So the weekly schedule does n't look too optimistic. The daily chart is inside the cloud, which means a neutral state. So, we have a weak uptrend on the weekly chart and a neutral one on the daily chart for QQQ.
The DIA ETF has been showing some strength recently. It has returned to the cloud, which is a "bullish" signal, but the future cloud is "bearish". This is when the Senkou Span A line is below the Senkou Span B. So that light blue line crossed right there. And since we are still effectively inside the candle, this suggests that the Dow is in a neutral position on the daily chart .
And on the weekly chart, it looks even more bullish than SPY and QQQ, right? The price closed above the nine-period line, so there is definitely a move from the S&P 500 and QQQ to the Dow Jones Industrial Average. Good. If you want to know the full list, click on this list of components and you will see some of the stocks included in it.
Now let's look at Russell. On the Russell 2000 chart, the weekly picture looks quite bearish. The fast moving average crossed the slow one from top to bottom, the nine-period one below the 26-period one. We are still in a state of decline. Although at least the weekly pattern that I see is actually quite " bullish", as we have a "bullish harami" - a large red candle followed by this small "bullish" candle that is inside the previous one.
"Bullish Harami" on the chart. Okay, you can find it here on my x.com page or Twitter. x.com for, excuse me, x.com/bluecloudtraders, where you'll find it. There is also a link on my YouTube channel. You just need to scroll down a little. Don't forget to click the " subscribe" button while you're here.
There are many of my posts here, as well as news and newspaper articles. Candlestick Patterns Reference Sheet . Click on this. Click once to enlarge and you'll see the patterns I'm talking about. Like a " bullish harami" right there. A large red candle followed by a small bullish one. And if you see this pattern after a price drop, it means that it may reverse.
This is not a guarantee, just a higher probability that we might see it . So, let's see. This is what is happening here. Russell, here's the daily schedule. You see, we've been holding above the nine-day period for 3 days now, but we're still below 200, 26 and clouds. So we don't have significant confirmation yet.
If I show you the resistance levels, you will see that Russell and I are now in bearish territory. The VIX, friends, essentially jumped 14.63%. It actually gapped up and rose above the moving averages. Right now on the daily chart it looks like a bullish pattern, and that's not good. VIX, you know, reflects fear in the markets and volatility.
And as the election approaches, it, of course, starts to grow a little. So uncertainty, I think, is part of it. And until they're over, it's true what Tom Lee said. After the elections, things should calm down, and there will be more clarity about where things are headed. But for now, expect a little more volatility until they pass.
Here is the weekly schedule. I mean, there's not much interesting here. I don't use a weekly chart for the VIX, only a daily chart to gauge the volatility we are seeing. But we need a backlash. When it moves up, markets usually fall. Here is also Euro Stoxx. Euro Stoxx 50, this is an ETF called FEZ.
It is also still in a descending channel. Truth? You can clearly see this as the price drops. And what do we have? We have a bear cloud. The price is below the nine-period, 26- period, 200- period lines and below the cloud. What about the cheapest beer, remember? It is below the price. So, things are looking very bearish for the Euro Stoxx 50.
What about gold? Gold is in the same situation. In fact, today it fell below the support level here. There was little support there. And boom, it fell 2.63% in a day. Here is the weekly schedule. Okay, it looks pretty bearish here too. Silver also looks bearish on the weekly chart. And on the daily chart, it falls below the monthly level of 49.61.
But I would wait until the end of October to know the exact status of this candle. Um, to confirm this. You know, this is the monthly level. Okay, let's switch to the monthly chart to see where it found support before. Okay, let's continue. Um, Bitcoin is another ETF I like to follow. And you see that it fell by 3.72%.
Yesterday and the day before yesterday, it showed good buy signals on the daily chart. But, as I said before, if you don't have confirmation on both timeframes, daily and weekly, okay? You run a much higher chance that your deal will not go as you expect. Because the higher timeframe is very important to understand the trend structure at this level .
Each of these candles now represents one week. And you can see exactly what happened week after week. The price of Bitcoin was stagnant. Okay, it was even going down, wasn't it? So, don't get too excited about Bitcoin right now. Um, I wouldn't rush into cryptocurrencies. Let's wait and see if it can actually break through the cloud on the weekly chart, and then it might make more sense.
You will get more confirmations. Ethereum—same situation. You can see here, on September 25th we were at a high of around 2650. Now we are at 2274. So it has already fallen 15.7% from that level. Okay, on the weekly schedule. But the daytime one. Well, again, it does n't look very good. Let's continue .
Now let's look at the stocks that were discussed. Not all of them, but a significant part, as I said, 34. Let's start with the strongest, here at the top, XLP. Let's take a look at this one. Let's start with the weekly schedule. This is the consumer staples sector . So, Spider. It rose 3.31%, a very good candle on the weekly chart.
You can see that we have a slight resistance at 90.34. Here is the daily schedule. Oh, here's the daily schedule. You see this future as a " bullish" cloud. Senkou Span A is above Senkou Span B, Tenkan-sen is above Kijun-sen, price is above the moving averages in the cloud. Chikou Span is pointing straight up.
So if that's not sector rotation, I do n't know what is. OK. Consumer goods are starting to show significant strength. AbbVie in the healthcare sector, a drug manufacturer. It looks pretty strong on the daily chart. It grew by only 0.03%. Here is the weekly schedule. Very strong schedule. A series of higher highs and higher lows is what we are looking for.
You know, all of this is confirmed. Even if you look at the directional movement index, again, as I mentioned earlier: when the green line is above the red line, it is a "bullish " signal, and if the ADX is growing, it means that the momentum is strengthening. IQV, another good example, right? Here is the weekly schedule.
We see that the price is holding very well above this support level, the green line, right? Here it is on the daily schedule. And today is the second day we have received new buy signals. Right now, this particular stock is still stuck in a consolidation zone. See this maximum right here? See how it seems to be stuck in this range?
But she looks quite ready for takeoff. Look at the ADX: the green line is above the red, volume is starting to increase right there on the daily chart. I like the IQV, but it's not quite ready yet. The XLV healthcare sector ETF looks quite strong on the daily chart. It increased by 1.32%. Here is the weekly chart, very bullish.
This is where the money is going, the inflow of capital is going into the healthcare sector . He goes into consumer goods, right? What about the rest of these sectors and ETFs? Well, let's start with SMH, it's a semiconductor ETF. It has been decreasing for 3 weeks in a row. In fact, it's down about 18%, a little more than 18% from its highs here.
In fact, more than 19%. So, semiconductors have been hit hard. Today, as we can see on the daily chart, we are below the cloud, minus 5.99%. We are now very close to support, the 200-day, the ascending 200-day. So, that's a good sign. But that doesn't change the fact that we are currently seeing a decline in SMH.
GRNY, that's Granny Shots, that's Tom Lee's ETF. Okay, this is also in a state of decline. This asset has fallen 6.6% from its highs here in October, on October 6, earlier this month. The cloud became bearish. Many of the stocks here are large- cap stocks. Large cap is taking a hit now. AMAT, Applied Materials Inc.
Here it is on the daily schedule. No, it's the same with this asset, it's under a cloud, as you can see. Friends, this is why I use this indicator, because I don't want to spend hours or a lot of time trying to analyze whether a technical picture is reliable. If you have a blank chart and only price, it won't give you as much information as it gives me.
At first glance, which is what Itimoku means, I can quickly assess what's going on and just let it go and say, "You know what? This is not the time for this. Maybe in the future things will change, but right now I'm just going to hold off on even considering adding this to my portfolio because I don't know exactly how much further it's going to fall.
Got it? It could keep falling. I mean, from the highs here on June 30th, it's down 49.64%. Are you ready to get in here? What evidence do you have that this is going to turn around right here? None. Okay? So what I'm looking for is market participation. I'm waiting for more money to come in, for capital to come in from big institutional investors.
That's not happening here. Okay? Money is going out, not coming in. So you're better off staying out. Amazon, yeah, bad day for Amazon. It's down 4.5%, 4.57% to be exact, and again It's below the cloud. Got it? Yesterday it was higher and today it's down. And here's the weekly chart. Also below the moving averages, but at least on the weekly chart it's still, you know, in a weak uptrend.
AXP, American Express, entered the cloud on the weekly, so it's neutral. On the daily chart it's below the cloud. It's showing some strength. The financial sector has been showing some strength the last 3 weeks or so. Baba, Alibaba, and some other guys, that's a different story, right? You can see where the price has been in the past and where it's going and we can better assess where to invest.
American Express, um, yeah, same thing. It's about to hit the 200 mark. So that's a strong resistance level. It's already hit the cloud. So be careful with it. But, I, um, yeah, on the weekly chart it could, it could break through. It's possible. Just watch it. Alibaba, okay. Alibaba does n't look too good either.
So you see it falling below the cloud, below the 200 mark. No thanks. Bank of America, same thing. Channel down. Okay, I was lucky to get out of, um, this deal right here. CBRS, Cerebras Systems Inc., semiconductors. Look at this one dropping like a rock too. Okay, no thanks, we're done with this one.
Capital One Financials is below the cloud. No thanks, no thanks, no thanks either. Let's look at the weekly chart. It's also below the cloud right now . So no. Coinbase, below the cloud on the weekly chart. Don't even look at the daily chart. CRWD, um, CrowdStrike is recovering right now. We see a bullish haram pattern right here on the weekly chart.
So that looks pretty good. What about the daily chart? Okay, there's still some weakness here. Why? The fast moving average is below the slow moving average, and the price is below both of those moving averages. Okay, so not for CrowdStrike at this particular time. What about CRWV, which is Coreweave?
They brought it up again . Well, it was holding above the 60-55 level. Remember, we talked about that in yesterday's video. I mentioned how the price was holding, which was a good sign, that it was holding for two, three, five days in a row. But guess what? The bears backed off. The battle. Think of it as a battle between the bulls and the bears.
Who's going to win? So, um, one of the things you can do is just draw a little box around the area and see if the price can break through it and close above that box, above the top of it or below the lows of, you know, that box . Guess what? The bearish trend won. The ADX was moving up, the red line was above the green line.
Everything was in perfect order for the bears here. So they took the initiative, and CRWV continues to fall. DRAM, Roundhill Memory ETF, continues to fall. This is, um, Roundhill Memory ETF, DRAM, on the daily chart, and here's the weekly chart, it's also falling. EWZ, Brazil, showed, um, a little bit of excitement this week, when the price jumped above 42.02, but it does n't seem to hold or come back above that level.
It seems to be losing momentum a little bit now. It's starting to take a little profit. That was back on October 9th. Here's the daily chart. You can see what's going on. It's, um, just rolling back a little bit or, you know, it's kind of in this little mini-channel down. So I wouldn't add to that, right?
It's down 1.55%. Let's move on. This is like a high-speed, I call it high-speed, uh, technical analysis, you know. Uh, Google. Under the cloud, let's skip Google, guys. Look at the daily chart. Things are n't looking too good for Google right now. Robinhood is also below the cloud. It has some support at the 200- day moving average around 93-94, but, uh, I wouldn't add anything there right now .
IBM, it 's starting to show some strength, right? You've seen it go up for a few weeks now , but it's inside the cloud, it's neutral territory on the daily chart, and on the weekly chart, we're below the cloud, so no. JP Morgan is between two moving averages on the weekly chart, and on the daily chart, it's below, so no, thank you, JP Morgan is not a good fit for us.
KLAC, KLAC, that's KLAC Corporation. As you can see here, it broke through the support level. So, you see, we had support here, here, and here, right? It held , and then it closed 3 days ago. What day was that? It was, um, Tuesday, October 20th, it closed at this low. And then— bang, the price gap down.
Got it? And here's the weekly chart entering the cloud. Going from a weak uptrend to a neutral zone. And if it drops below the cloud, it's actually a downtrend. LRCX has n't quite entered the cloud on the weekly chart yet. There's a possibility of a rebound on the weekly chart . On the daily chart, things don't look too good for Lam Research.
Netflix, um, okay, that's interesting. I'm looking at this level . Let me just draw a trend line, a support level. If you look at the daily chart, the low there is 6508. I'll add that for you. Okay, and let me look here. Where did it close? It closed at 6504. It closed below that level, but then it opened with a gap up.
You see, the bulls tried to push it back higher that day, and they were successful in pushing it back higher. This could potentially be a double bottom for Netflix. Maybe. But I wouldn't risk it while the price below the cloud and below , you can see this weekly double bottom more clearly. I think it looks more like a double bottom on the weekly chart, so I personally wouldn't make any decisions until next week, probably Friday, because I want to see...as we see here, we're ending the week with a hammer candle, but it's a red candle .
I'll probably look to see if price can break above that level, at least on the weekly chart. If you're into that type of trading. Personally, I would n't, again. But, you know, if you want to get into a Netflix trade early, I would wait until it breaks above the 200-day and 9- period moving averages.
There's a lot of resistance up there, so you're really taking a lot of risk. ServiceNow looks pretty interesting. I like what's happening on the weekly chart. It's been a very important week for ServiceNow. It broke through the cloud, and it looks like there's going to be a strong candle tomorrow. There's one more trading day left.
So if ServiceNow continues to rise tomorrow, that would be a very bullish signal for it. The cloud itself looks like it's going to be bullish soon, but not quite yet. The Directional Movement Index gives us the green light here on the weekly chart. Price has risen above the 200 mark. The Chikou Span is above the price.
Things are looking pretty good on the weekly chart. Here's the daily chart. Very bullish. So ServiceNow is almost there. Oracle is below the cloud on the daily chart. Thanks, but no. And the same on the weekly chart . SKYD, Paramount Skydance Corporation. We have a bullish harami, but on the weekly chart we're below the cloud, and on the daily chart we're below the cloud.
No thanks. SpaceX is entering the cloud. It's in neutral territory on the daily chart right now. Here's the candle reversal. It opened with a gap down and fell into the cloud. So, SpaceX—no. Spotify jumped 11.13% today. Very bullish daily chart. Got it? I like everything on the daily chart. What I don't like yet is the weekly chart.
We're right at the resistance level, at the top of the cloud. But I like what's happening with the directional movement index. So Spotify could potentially break the cloud next week. So keep that in mind. VST, Vistra Corporation—below the cloud on both the weekly and daily charts. No. WFC is also below the cloud on both the daily and weekly charts.
XLF is above the cloud, my friends, above the cloud on the weekly chart. Very bullish signal. That's what I'm talking about. Remember I mentioned that the financial sector has been showing strength for the last 3 weeks? That's a good sign. So the weekly chart meets the criteria that we looking for. Right?
The only thing that's probably missing, if you look at the directional movement index, is that the green line hasn't quite crossed the red line yet, but it looks like it's about to . And if we go to the daily chart, we don't have confirmation here either. But the cloud is very thin. It could break through next week or even Friday of this week.
So it's very interesting. Keep an eye on it, okay? ZS, Zscaler. On the daily chart, everything looks very bullish. It's the technology sector , the software infrastructure. I like the daily chart, but on the weekly chart, we still have a bearish cloud. Senkou Span A and Senkou Span B. The only positive is that the price closed above the cloud.
So that's good. There's potential here. We can see that we actually got a higher low here. Even though it was a small move up, it's still a move up. And we broke through that high here. So there's a higher probability that we we'll see the uptrend continue. So watch ZS as well . This is a very old trend line that dates back to 2024.
That's where it could meet resistance around 259.61. Watch that level. Notice how it found support at this same level here, back in 2025. That's all for today in this video guys. So before you go, if you can, take 5 seconds and hit the like button and subscribe. It's free. Hit the notification bell and you'll get notified when I release a new video.
This is very important. If you want more content, this is where I go to exclusive videos. Videos that aren't shown here. These videos. Remember, just videos. You need to click the Join button here. Next to the Subscribe button. And then you need to select Blue Cloud Trader. At that level, click the Join button and you'll be able to access those videos.
If you want even more, the membership level Blue Cloud Legend will give you those exclusive videos for members, as well as the ability to request analysis of three stocks or ETFs in the next video. There are a few day trading videos at this level, and you'll get daily stock and ETF trading updates that I post right next to the post.
Once you join, there's a new tab called Membership, okay? And you can access it right here on YouTube, which is super convenient. Thanks again. Have a great evening or afternoon, wherever you are, and I'll see you in the next video. Ichimoku Guiding Light. Trading the Blue Cloud All Night. Mm.




Comments 0