
저자: TomLee/그외CNBC패널 · 외국인
요약 보기
Tom Lee은 S&P가 사상 최고가 근처지만 AI 투자 우려, 에너지·지정학 리스크 등으로 불안하나 펀더멘털이 강해 스프링처럼 결국 극복할 것이라 주장. 헤지펀드가 AI 관련 포지션을 거의 청산해 매도 압력이 나왔고 이는 기회라며 AI 반도체·소프트웨어 투자를 언급. 암호화폐는 월가가 블록체인 기반 금융을 인정하면서 상승 동력이 있다고 봄. 패널들은 S&P 500 실적 성장률(24.6%) 등을 근거로 강세장 지속과 섹터 로테이션을 말함. 다만 방어주 중심 랠리의 지속성, 금리 방향에 대해서는 이견이 있음.
다듬은 글
Blue Cloud trading continued all night long. Welcome back to the channel, everyone . I will play a few CNBC clips for you in a moment . Let's examine the chart and use technical analysis to see if the price movements support the experts' opinions . If you haven't subscribed yet, please subscribe, and let's play the first clip.
We have invited Tom Lee, Head of Research at Fundstrat Global Advisors and a CNBC contributor, and Ben Emmons, founder of FedWatch Advisors . Thank you both for appearing . Tom, let me ask you first. Given that the S&P index has shown significant sideways movement over the past few months, how would you explain the current market situation ?
hello. Yes, the S&P index actually held up very well. It is very close to an all-time high, but as you know, there is tremendous anxiety behind it . This is because we are trying to digest various factors of concern . There are many factors to consider, ranging from artificial intelligence (AI) investment and financing methods to the growth rates of these advanced models .
Furthermore, energy is also very important, but there is great uncertainty. This is because prices are high, and the wars in both Ukraine and Iran are intensifying . In addition, investment sentiment is negative as criticism regarding corporate valuation is intensifying . All of this may sound a bit unsettling , but I think it is because the fundamentals are very strong .
It is just like a tightly wound spring. I think the stock market will eventually overcome this crisis , but right now is a very worrying time. hmm. To use the analogy of a tightly wound spring, Tom, given that the focus has been on rotation within the S&P indices during recent trading sessions , what investment opportunities do you see right now ?
In fact, if you look at stocks and compare semiconductor stocks with the equal-weighted S&P index, there is a somewhat inverse correlation. In that case, do these two factors need to be in better harmony to see stock prices actually rise and a spring rebound ? Well, I think there is an opportunity where investors are liquidating their positions .
I saw a brokerage report stating that hedge funds' AI-related positions have been almost completely liquidated . I think this is the main cause of the selling pressure . However, that very part is also an opportunity. This is because the visible growth drivers driving the earnings of S&P companies stem from AI and related bottlenecks .
And the valuation in this sector is still quite reasonable. Therefore, while many people are afraid of this situation, I think it is worth considering investing in AI semiconductor software . AI downstream companies and cryptocurrencies were also caught up in the same sell-off . Tom, I would also like to hear your thoughts on this .
You just mentioned cryptocurrency, and it has risen sharply recently. I am curious to know what you think is driving this upward trend . Is it due to the introduction of financial infrastructure and convergence with AI, or is it due to macroeconomic factors such as geopolitical and political tensions ?
I spoke with Steve Sedgwick about the situation in France, and we also mentioned the impact on the asset market . Morgan, all these factors are acting as positive catalysts for cryptocurrency . The fact that the Fed is not pursuing a dovish monetary policy is an exception, but nevertheless, the resilience of cryptocurrency is surprising.
However, in my opinion, the biggest, perhaps most prominent, driving force behind cryptocurrency right now is that Wall Street recognizes that the future financial system will be built on blockchain . Apart from the cyber security threats across the entire financial infrastructure caused by AI . BlackRock has explicitly stated that it will build collateral through blockchain-based tokenized products .
Vlad Tenev of Robin Hood said he believes the entire financial system will be built on top of blockchain . And today, JP Morgan announced that it is developing an Ethereum-based stablecoin . In my opinion, this shows that Wall Street recognizes the payment efficiency and security provided by blockchain .
In fact, this is a tremendous opportunity. This is because all economic transactions occurring worldwide , and everything in the real world, are now financial transactions . Naturally, this is a great opportunity for blockchain. yes . Everyone, thank you for starting this time so wonderfully. Tom, Liam, Ben Emmons.
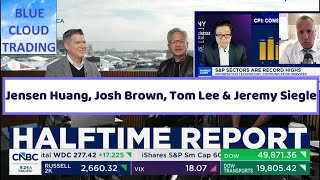
you're welcome . Yes, everyone. Welcome to the Halftime Report . thank you. Hello, this is Scott Wapner. In this session, we will take an in-depth look at rotation trading, which has emerged as sectors other than technology stocks lead the market . I will discuss and deliberate on this topic with the Investment Committee .
Joining us today are Joe Terranova, Jim Kramer, Bill Kevin Simpson, and Josh Brown. The market showed an overall upward trend today. As you can see, the Dow Jones Index rose the most . It went up by about 1%. AI- related stocks are showing mixed trends . South Korean data center company Elice plummeted 32% on its first day of trading.
Joe Terranova predicted that HSBC's Core Weave would fall another 30% today . Housing-related indicators showed dismal results. Oil prices are around $100. Nevertheless, the stock price rose. The yield curve has flattened. It seems like the market is saying, "The housing market is in such a bad state, and on top of that, with all sorts of concerns piling up, there won't be a rate hike in October.
It might go up in December, but let's think about it then ." Does this move mean that? Well, I think the fact that oil prices dropped to $110 early this morning also had a big impact . I don't know if it's true or not, but the price dropped significantly because of some headlines . I won't go into detail about that part , but in any case, you can't ignore the price movements .
I still think there are investment opportunities related to AI . Do you think so ? Yes, I think there are investment opportunities related to AI. That does n't mean I won't hold stocks related to healthcare or financial services with good performance. However, seeing how hedge funds have rapidly adjusted their positions and reduced their exposure over the past month, I think a good foundation has been laid for a bull market in November and December .
Looking at today's price movements... regarding Coreweave, as I mentioned yesterday , I will not be involved in predicting how the stock price will move from an analytical perspective . It is because I did not look into it closely . However, today's stock price movement looks positive. As bad and good news originating from Korea overlapped, the stock price, which had been on an upward trend, turned into a downward trend .
Yesterday, Core Weave was on an upward trend but then turned downward. Today, it looked like stock prices would fall due to negative news from Korea, but they did not. This can be interpreted as a signal that positions can be rebuilt and the trend will continue into 2026, as leverage reduction in AI semiconductor-related investments has been sufficiently achieved .
Josh, I mentioned various situations, and UBS stated today that the bull market is still valid . The USB appears to be stable. What could be the reason ? The reasons are robust economic growth, increased corporate profits, and investment and adoption of AI . Monetary policy is no longer a driving force for growth, but we do not expect the Fed to rush to raise interest rates .
Aggressively raising interest rates . It is in a similar context to what I just mentioned. We believe there is still significant upside potential in the stock market . They are maintaining their mid-2027 target for the S&P 500 index . For reference, the target for June is 8,400. The important thing is that they do not think the market is ending or will end soon .
Yes, so it seems they are repeating what they have been talking about on our broadcast . One of the most notable features we witnessed over the past year is that, as seen in the recent semiconductor industry, when a market-leading company collapses, investors seek out other investment targets and buy them.
Thanks to this cyclical trading, we have been able to survive for a long time . It is almost meaningless to repeat this, but it is true. Some people expect that a difficult market environment will be created, but the reality is not like that. Consider this background . Earnings for S&P 500 companies are expected to grow 24.6% during the current earnings period .
This is 6 basis points higher than market expectations . It has been like that since the beginning of the season . So that part of the long-term investment logic is still valid. Performance is good and exceeding expectations . 79% of S&P companies have released earnings , a figure that exceeded expectations.
Of course, the number is not large. Sales growth is also being observed. It was not merely a share buyback or a showpiece move, but rather recorded 12.3% sales growth compared to the previous year. This is 20bp higher than the early-season forecast . Profit growth can be expected in 10 out of 11 industries.
High growth rates are being shown not only in technology stocks but also in materials, energy, and other sectors . And considering how well things are going right now—and as I will discuss later in today's broadcast—the tremendous rise in the healthcare sector aligns with what I mentioned at the beginning .
In addition to semiconductors, memory, and the cloud computing sector that people are concerned about, we have identified areas with growth potential . Stocks have absolutely nothing to do with that problem . I agree with Joe saying that AI is still the biggest investment target , and I certainly agree as well.
However, AI is not the only investment target, and this is really important if the bull market is to continue until the end of the year . Jim, that is exactly the point. There is a debate going on about whether the bull market is collapsing, on the verge of collapse, remaining intact, or transforming into a new phase .
This is a point people are debating , and people like you want to believe that the bull market is transforming into a new phase, or that even if it isn't yet, it will . The expression "things you want to believe" is interesting. And I know that ' hope' is the father of thought . You ask why I said 'hope'?
What can you do with a rotation of just a few days ? This is what I am seeing right now . If you would like, I can show it to you later , or I can show it to you right now. Yes, this is it. Equally weighted S&P 500 versus market capitalization weighted... Ah, you are showing it to me. Ah, so you were going to show me .
Ah, I did n't realize it was time for our presentation. Shall we check if the computer has a password? Is your Social Security number exposed here? Equal-weighted index vs. market capitalization- weighted index... Everyone, could you please step forward? Could you please show me the S&P 500 equal-weighted index graph?
That way, I won't have to disclose Jim's bank account information to the viewers . The reason I'm doing this is so you guys can say, "What are you talking about, Jimmy ?" I thought they would say that. " However, the simple truth is this : the equal-weighted S&P 500 and the market cap-weighted S&P 500 have been tied since the beginning of the year.
Completely tied . There were many times when the equal-weighted approach outperformed, and many times when it underperformed. Therefore, the new composition—and I like the expression, to reiterate—has been ongoing throughout this year, and as a result, we have reached a tie. If you are wondering what position I hold and what investments I recommend to clients , let's assume that technology stocks account for 40% of the S&P 500.
Some investors find it uncomfortable to invest 40% of their portfolio in technology stocks. So, what should I do? I reduce it to 36% . While that is still a significant weighting , I can utilize those 4 percentage points to invest in sectors that perform well while acting as a defensive asset, such as energy or healthcare, as Josh mentioned.
That is exactly what I want to convey ." You do not need to invest all your funds in AI or tech stocks exactly like the S&P 500 index . There are many other places where you can make money, and in fact, such investments have been effective throughout this year . However, what do you think if someone says the earnings boom for AI-related companies is about to end ?
Um, first of all, I didn't know if I was allowed to bring props . If you had brought it, I would have shown you something like a chart . Ah, it's a relief you didn't bring it . It's a relief that there are rules. Hmm, Scott, I don't think so . Do you think the earnings boom will end soon? For example, let's assume that in 2026, X% of the total earnings growth comes from technology stocks .
That must be a huge figure. But I told you that it wouldn't be that figure in 2027 . And in 2028, it is expected to be much lower than in 2026 . Doesn't that match Jim's argument ? Is it still reliable ? What if you think the economy will still remain in a fairly good state during that period ? I think Jim's claim is quite credible when considering the scenario of 28.
First of all, I think that in 2027, there will be tremendous profits in the AI and technology sectors. So I think it is important to invest at that point , but polarization will definitely occur. It will likely be divided into those who have and those who do not . Companies generating massive profits in the AI field will emerge and bring about revolutionary changes .
On the other hand, there will also be companies struggling with debt . We confirmed this last week through a stock price revaluation and a reality check . I think there will be a significant difference because many companies relying on the AI revolution are burdened with debt and borrowing money .
I also hope to diversify my investment portfolio, as tech stocks account for only 25% of my holdings. I hope that the weight of tech stocks remains even , but people think that it will eventually happen . You must always invest in innovation . And I don't think giving up on tech stocks and diversifying your portfolio is a good idea at all .
Where do you place the highest emphasis ? The weight is too low right now . Where do you place the highest emphasis ? Currently, we place a high weight on healthcare, energy, and metals , and we are also investing in agriculture . So, they are pursuing an aggressive investment strategy . It is not limited to technology stocks, but they are making aggressive investments in the energy and materials sectors, even if not to the extent of the S&P 500 .
But what if I keep using the word 'portfolio ,' Jo? I wonder if people are confusing portfolio diversification with defensive investing . It makes it feel like it isn't diversification in a positive direction . Consumer staples, utilities, and the healthcare you are enthusiastic about are defensive investments in the market.
Even Bank of America has said that this sector could become a bubble . From a broader perspective , the U.S. stock market exhibits sharp fluctuations under stress . Given that defensive stocks have recently shown a historically extreme rally compared to tech stocks, it is difficult to expect the market to collapse.
Am I right? Seeing how much money is flowing into various fields , it seems they believe the market will expand again, just as I mentioned . However, if that expansion is mostly concentrated in defensive sectors , is it really a phenomenon worth trusting and investing in? That is a very accurate point.
And here is the evidence to support this . Looking at market investment factors for the month of October , low-volatility stocks performed best over the past 24 months . I think this shows the defensive nature of the market . The consistent trend in 2026 and the reason for this rotation is that the market capriciously oscillates between fear and greed .
There is no middle ground. Fear, greed, fear, greed. And the reason I believe the market is currently inherently defensive and there are opportunities in the fields of AI, semiconductors, memory, and optics is that the market has reduced its positions in these sectors due to being too skewed by fear .
Jimmy, you mentioned that technology stocks account for 40% of the S&P 500 , and no one would dispute the premise that we should hold Apple, Nvidia, Microsoft, Mag7, etc. These are actually companies that make up a significant portion of the S&P 500 . I am talking about pure AI-related investment opportunities that have been stagnant since June, hidden behind the surface.
That's a really great idea. I agree as well . Yes, but we are all stock investors here, aren't we? So, regarding AI investment, you mentioned Apple first , but I believe in AI investment . We talked yesterday, too . I won't mention it again , but let's take Apple as an example . You do not need to hold all stocks .
If Apple's market capitalization weighting is this multiple , well, you know we talked about this . great. That's exactly what drives the market, isn't it? I sold stock worth about half of Apple's market capitalization at around $330 before two earnings announcements . Yes, it has risen to $340 now.
What's the problem? oh my god. The thing is, it went up. great. All right. You're doing great. My point is that you don't need to follow the S&P 500 index for every stock . In terms of market capitalization, increasing your weighting in Microsoft is a good idea. The same goes for Google, Alphabet, and Amazon .
Hmm, Scott, that's a good question . Is this a defensive investment or an expansionary investment? That is a really good question. And I always...that is a good question. Just leave it alone. Did everything end when Germany bombed Pearl Harbor? No. However, a question arises here, and think about how the answer to this question might be resolved .
It itself, you see. Will financial stocks rebound? What about industrial stocks? Yes, energy and materials stock prices are rising, and as I have often mentioned, that is important. yes . You will have to check it yourself . If Antropic goes public and Open Eye raises funds as planned, investor sentiment toward financial stocks could revive.
However, that is precisely the signal showing the movement of financial stocks . For that to happen, oil prices must fall further and bond yields must also decrease. The rate of return is not an issue. I can say with certainty that this is the case . The 10-year Treasury yield is 5.10%. Could you tell me about Core Weave?
Ah, I understand. I will tell you about the Core Weave. Then what about the remaining 499 stocks included in the S&P 500 ? You will probably roll your eyes. However, if interest rates rise, there will certainly be stocks that struggle . However, the market has already adapted to 5.1%, and now no one will pay attention to those stocks .
People say that 5.1% is a nosebleed- inducingly high interest rate , but that's not the case. This is a normal interest rate. Josh, you are falling for the wrong reason . If interest rates rise, it helps them. It means that higher interest rates are helpful . The funniest part of 2026 is exactly this.
The point is that high interest rates are beneficial to the market . How would that be helpful ? It doesn't help the company internally at all, you know. Everyone is flocking to safe assets. Everyone is buying up companies that are not affected by high interest rates , and those companies account for 40% of the total stock market.
Google, Apple, Nvidia... Do you think Nvidia will care about interest rates ? "Oh no. We might have to invest more equity in the Neo Cloud we support ." That is probably all they think. "They do n't care. Apple cares even less. They laugh at AI capital expenditures. In fact, paradoxically, high interest rates are making the rich richer.
Suddenly, money market funds are surging again like a fountain of money . This fuels consumption spending among the high-income class , causing people to flock back to the stock market—especially Mag7 indices—and drive up the S&P . So, the idea that 'a 5% interest rate cut means we have to run and hide ' is completely wrong.
No one wants to watch interest rates plummet . In fact, that would likely be much scarier . Why are interest rates falling ? That is exactly my point. Interest rates are falling for the wrong reasons . It is wrong to think, 'This is the appropriate rate, so everything is fine now .' Why have interest rates fallen?" "Why do you think prices have dropped further ?
Because they were too high. Scott, that is all there is to it. The drop in the 10-year yield from 5.3 to 5.1 indicates overheating." If you think that aside from resolving the issues, there is another reason— namely, that this indicates an economic recession— well, you don't have to agree with my opinion.
Look at the numbers. The Atlanta Fed announced today that this quarter's real GDP growth rate is projected at 3.5%. You can look at any indicator, such as weekly jobless claims or industrial production . It is unreasonable to conclude that there are serious economic problems severe enough to warrant a 20 basis point drop in interest rates .
However, if AI- related stocks start to plummet , the stench spreads throughout the entire surrounding area, just like a foul odor emanating from a trash can. Wait a minute. You said AI stocks have plummeted? Meta is showing a tremendous upward trend . Google has come down from its peak, but it is fine .
I think Amazon went up about 5% yesterday ? No, but I am not talking about mega-cap stocks. I am talking about other companies that are currently in the middle of the market vortex . I am not saying this lightly. As I said today and yesterday , I do not believe that AI-related investments have reached their peak yet .
Of course, I could be wrong, but right now... It feels different from 1999. These data centers remain profitable from the moment they become operational , and if they haven't approached the investment peak within a year , we just need to give companies like CoreWeave or Oracle a little more time to emerge .
I have no intention of selling Oracle. However, since Scott started by asking about financial stocks—that is, sectors other than tech stocks—let me wrap up my thoughts . If dividend yields remain high , do you think it is okay for financial stocks to rise in such an environment ? Of course. Absolutely.
And to add to that , it is not simply a matter of yield . You said yields would remain high, but I think the current yield is decent. 5.1% ? I am not surprised at all . As Josh said, it is a decent level for the S&P index . If the S&P index continues its upward trend, then I will worry again. If you look at the chart for the 10-year Treasury yield, there is a section where it shows distinct sharp fluctuations before stabilizing again.
I wouldn't be surprised if it settles in the range between 4.8% and 5.2% . And as Josh said, if the rate of return drops below 5%, "Good heavens, what is happening to the economy ?" There will be an uproar saying that . It seems we have entered a new range . Let's talk about other fields as well . Because there are related movements.
Healthcare stocks hit all-time highs today , Josh, and you 've bought a new stock. This is West Pharmaceutical. This stock is on the list of promising prospects. Could you tell me why you bought it ? Joe T also included West Pharmaceuticals in his ETF, and I see that Josh bought some as well. I am curious about the reason.
Josh, you covered West Pharmaceuticals on the broadcast on October 1st; I should have bought it right then . At the time, it was expected that a breakthrough was in progress , and a breakthrough actually occurred. Although I bought it at a slightly high price , it is a much larger breakout compared to the peak nearly 5 years ago .
Wait, let's take another look at this stock . West manufactures rubber stoppers, seals, and pistons used in vials and syringes, and also makes automatic syringes . We sell products to all pharmaceutical and biotech companies and produce everything from biological agents to, of course, GLP-1 . People all over the country are taking this medicine.
I went to Jared Freed's stand- up comedy show, and the whole show was about Ozempic. The audience all nodded their heads . It is a business with tremendous growth potential. West Pharma was once a boring stock, but now it is showing signs of rising much more significantly . I also added it to my portfolio.
Oh, and there's a problem with the audio. While you fix that, would you like to talk about this stock you hold? I bought it for about $296 in April . Josh is right. Sales growth is accelerating, driven by the growth of peptide products as well as obesity treatments, and increasing demand for better equipment and technology related to medical services themselves .
It is a very solid company , and its market capitalization is only $27 billion . yes. And you also have an investment stock, right? I haven't been able to reconnect with Josh yet . Right? Are you still working on it? all right. Please let me know. thank you. Please. Mr. Scott, you have a plan too, don't you ?
You mentioned the name "healthcare" earlier, and we all have a great interest in that field . Mr. Scott, I'm not sure if the healthcare market is necessarily expanding, but I think investors are flocking to the qualitative side. Quality can be subjective, but there are many opportunities in the healthcare field.
We repurchased United Health Care stock . This is the third time I have reclaimed this position in the past month . I sold this stock last year. Although we faced difficulties for various reasons , looking at last week's earnings report, it seems the buyback was the right choice. Revenue increased, Medicare ratios improved, and annual earnings forecasts were revised upward.
There are definitely problems with United Health Care. Because not everything has become a thing of the past . You do n't have to be perfect. It is important to see that it is improving. That was clearly evident in last week's earnings announcement . We like this sport. I had it last time too . It has been like that for over 10 years .
I still hope that it will be like that again, but the current trend is heading in the right direction, and it is the result of a combination of momentum and quality. It seems like you have more to say. Yes, there is. Let's talk about a healthcare company that demonstrates remarkable resilience, trades like a biotech firm, and has a market capitalization of $1.2 trillion .
And surprisingly , it hit an all-time high again today , Scott. This is Eli Lilly. It has broken the all- time high again . Many people have argued that this company's stock price growth rate will not be sustainable . Eli Lilly is a dominant player in the GLP-1 field and plans to diversify its business model through $20 billion in mergers and acquisitions by 2026 based on revenue growth.
Go back two years and think about the competitive landscape of GLP-1 . At the time, Eli Lilly had a market capitalization of about $750 billion, and on the other hand... do you remember Novo Nordisk? Jimmy, Novo Nordisk's market capitalization was nearly $600 billion in June 2024, right? At the time, the gap between the two teams in the league championship race was only two games , and there were 12 games remaining.
Currently, the market capitalization amounts to $1.2 trillion . Novo Nordisk is n't even $200 billion. Lilly completely overwhelmed its competitors . That's really amazing. Lilly has secured a clear advantage as the winner of GLP-1 and is also diversifying its business. I continue to hold Lilly stock .
Goldman Sachs bought Lilly stock at $1,413 today, and Bank of America at $1,397 . Both companies are expecting an upward trend in the future . Josh, I will contact you again when the audio is reconnected . West Pharma, you just cut off a little bit. Could you please continue ? I think it's because of rounding .
3rd base. Well, I think the key point is very simple . A perfect combination of fundamentals has been formed , and these fundamentals are gaining momentum, and Wall Street has also started to take notice. It appears that an upward trend from the peak five years ago is imminent . West Pharma's high value-added components grew 19% in the recent quarterly earnings announcement and currently account for 49% of revenue.
In the past, people thought of this company as merely a manufacturer of plastic pipettes , but that is not actually the case. GLP-1 accounts for 18% of sales , and gross margin has increased by 200bp to currently stand at 37.7% . This brings high value-added revenue to all pharmaceutical companies, including Eli .
It is a global market and is relatively less affected by economic fluctuations . Becton Dickinson is buying a large amount of this company's stock . There are numerous companies in this field, including Waters, which I will talk about later . That's really amazing. More quant analysts and traders than ever before are paying attention to these stocks in years .
I think this is a positive sign. Yes, welcome back. As further evidence today, recent housing market data has been terrible. I have no other way to express it . Today's data was completely off the mark. And Josh, you sold your Rocket-related stocks. Does that mean you are raising the white flag and washing your hands of it ?
Is this transaction, this sector, all of this a mess? Yes, that is exactly right. I sold most of my stocks a long time ago. I kept a little bit of it, hoping that these companies could recover if interest rates were actually lowered, but I do n't know how that would happen. It seems to be of almost no value.
There are many much more valuable investment opportunities in the market . There is an Apache proverb that goes like this . The best strategy when riding a dead horse is ... dismount. I think this company is in a fantastic position , but it is not enough to overcome the housing market downturn we are currently experiencing .
And you probably won't be able to overcome it either. There is almost nothing they can do . I spoke with the CEO, and he said there was nothing else they could do. It is just a matter of time . Eventually, housing and mortgage-related investments will regain popularity. But today is not the day. Yes, Lowe's has fallen 42% since the beginning of the year .
There is exposure to the housing market. I would like to hear both of your opinions. First, Mr. Scott. I am at Home Depot . Home Depot is also a retailer. Since this stock moves inversely to interest rates, I hope Jimmy's prediction is wrong . I hope interest rates go down . However, as Josh said, even if interest rates do not go down, there is a supercycle in the housing market.
During the COVID-19 pandemic, we all refurbished our homes. Things like wallpaper, I mean. Flooring, home appliances. You will have to refresh once again in 6, 7, or 8 years . So, if you hold Home Depot or Lowe's stock, I think you should look at 2028, not 2027 . Pulte Group is the stock we hold. It has fallen 7% over the past 52 weeks and hit a 52-week low 5 days ago .
It is difficult to view this as an upward trend . Now, let's take a look at the other stocks . Live Nation is a stock that Josh has held for a long time , and as far as I remember, it is a stock that he has always maintained an optimistic outlook on. Today, CFRA issued a sell recommendation . The target price is $167.
It has broken below $175 . It is located in the section between the two support lines . CFRA cited venue expansion costs, increased operating profit due to ticket sales adjustments , and increased debt . What do you think ? The rating has dropped countless times during the period I invested in this stock .
Hmm, this one is really funny. They are issuing a sell recommendation, saying that while it is $174, $167 would be acceptable . Why on earth is this happening? Tomorrow, it could drop to $167 for no reason, or it could rebound to $187 . I tend not to pay attention to things like this, so I wo n't be giving a buy recommendation .
yes that's right. The big picture is very simple . This is an unrivaled, top-tier live entertainment asset . There is no other listed company that can express the idea that people like to gather together, like to have experiences, and like to watch performances . People have enjoyed listening to music for most of human history spanning 100,000 years .
It probably won't change . Live Nation is the world's best in the field of venue operations , and now they handle venue construction, ticket sales, artist collaborations, merchandise sales, and so on. Well, since I am an investor who never sells, I hardly care what this analyst writes in the report.
I think it would actually be better to eat breakfast. Morgan Stanley Overweights Spotify, Target Price $640. Josh holds a position, and since Kevin maintained his, could you tell me? Yes, we have always been keeping an eye on Spotify as an alternative to Netflix in the audio streaming field . Spotify is a much more global company.
There is still great potential for growth . It's surprising that the stock price has stagnated to this extent. The target price might be a bit extreme, but I believe it will rise further in the future . Shall we take a look at one more? BlackRock upgraded its rating from hold to buy, and Cowen did the same today.
The target price is $1,405. $1212. $1,212 was the previous target price, so it has gone up quite a bit. Earnings per share (EPS) are expected to be over $100 . Jimmy, I think it is a good stock to hold for the long term. However, as I have mentioned several times over the past few years , and as you can see in the chart (this is a chart covering about 6 months ), the stock price shows signs of rising and then faltering .
Ultimately, since this company is an asset consolidation firm, its Assets Under Management (AUM) must increase, and as AUM increases and the market rises, earnings must also increase . Therefore, compound growth is expected in the long term, but it has shown somewhat sluggish performance so far . great.
Let's take a look at the market's best stocks selected by Dom Chu and Josh Brown . Waters Corp has been newly added to the list. Could you please explain this company in more detail ? Yes, it is another healthcare-related stock. Waters manufactures instruments and software used to separate and identify molecules in laboratories .
It is a truly amazing business. Revenue for the second quarter was $1.65 billion , and adjusted earnings per share were $3 . Both exceeded market expectations . Management took this opportunity to raise the annual earnings per share forecast . The company is scheduled to announce its next earnings on November 3 .
This stock has risen 57% from its low in March. It is showing a truly remarkable upward trend . We suggest a reasonable stop-loss price of $420 to investors . This is the low point in early October and the 50-day moving average line . Investors can afford to be a little more lenient up to $390 . This is the low point in August and September , and it has recorded support/resistance at this level twice .
Memory plays a role in price. Another brand is Thermo Fisher. I included this stock on the list of the market's best stocks last November . Now, nearly a year later, I judged that there was a high probability this stock would skyrocket and said, "If I had to choose , it seems likely to go up ." It has risen 19% since the call .
Thermo Fisher is the largest company in the life sciences tools sector , recording $46 billion in revenue over the past 12 months . Revenue increased 10% compared to the recent report . Since breaking out of a long sideways range in late July, the stock has never fallen back below 555 cents. And following a correction, it rose to 703 cents on Thursday, setting a new record.
Although there has been a slight correction again now, the RSI remains very strong at 64. We advise traders to use 650 cents as a stop-loss level. This is the low prior to the recent breakout. Investors could also use the weekly closing price of 600 cents as a benchmark . Check it out on Friday afternoon .
If it falls below 600 cents, there is a possibility that the major uptrend will end, which is a reasonable point from a risk management perspective. Yes, Mr. Josh Brown. What was your last trade? Let's talk about Amazon. This stock has highs and lows as it rises toward an early summer high. It is showing an upward pattern.
And I think a breakthrough will be achieved when they announce their earnings . thank you. Ah, you are Mr. Kev from United Health Care, right? Yes, Mr. Scott from United Health Care . I think the recovery is worth waiting for . Palmer Gym. eBay. That's a really cool chart. look. great. The promise was kept.
yes . I personally bought Twill Rio 258 just before the market closed yesterday . The recovery is in progress. great. Thank you for the good information . Hello everyone. Welcome to the end of this video . The name of this channel is Blue Cloud Trading , and we will take a look at the various stocks and ETFs that Josh Brown and Tom Lee discussed .
Well, I will show you that list and, while looking at the indices here, I will show you what is happening in the market and what happened during the day . Hmm, are you ready? Let's take a look at the approximately 11 ETFs shown here . For example, it is ProShares K-1 Precrude, a crude oil ETF . Let's take a look at the Oil Strategy ETF .
We plan to analyze the S&P 500, QQQ, Dow Jones, Russell 2000, VIX, Eurozone stocks, gold, silver, Bitcoin, and Ethereum . I am going to use the Ichimoku indicator, so I will explain how it works. This indicator will help you identify the strength of the trend . I will also take a look at Apple and the Scientific .
There are really a lot of stocks and ETFs mixed in here , as many as 23 of them. There are stocks like Google, Mac 7, Nvidia, and Microsoft, and there is also Tesla. And we will also take a look at the four stocks recommended by one of our members . So, shall we start the market analysis ? How were the market conditions today?
Most indices rose. The S&P 500 rose slightly by 0.28%. It gapped down in the morning, but rebounded afterwards. An upward trend began but lost a significant portion of its momentum and eventually ended up rising by only 0.28%. The Nasdaq showed a similar pattern , opening with a gap down in the morning .
So, it appeared to be on a downward trend in the morning. Ah, what did I just say ? I guess I'll have to go back. Yes, that is correct. It started with a gap down in the morning, showed signs of recovery, but then fell slightly again . In the end, it fell 0.02% by the close of trading. The Dow Jones Index rose 1.02% .
This index maintained a flat trend . The Russell 2000 index rose the most, by 1.66% . Now, let's take a look at the heat map. It shows the movements of individual stocks included in the S&P 500 index by market capitalization . As you can see, healthcare-related stocks showed a good trend today . Eli Lilly, Johnson & Johnson, Merck, Amgen, and others rose.
Diagnostic research companies and healthcare-related firms also achieved good results. hmm. Utility stocks did quite well . The real estate was good, too . Most financial stocks also showed an upward trend . However, as you can see, major tech stocks showed a downward trend. So overall, it wasn't good .
Looking at the equally weighted average, most stocks rose, but large industrial stocks such as GE, Vernova, and Eaton also fell. Ah, the Parker-Honey pin fell 2.24%. Aerospace and defense companies such as GE Aerospace and Triumph Aerospace fell 3.82%. Alright then, shall we get started? First, let's take a look at oil prices .
I will set the chart aside and remove the trend line for a moment . I am here to show you the technical analysis . Now, let's take a look . Here, we are using the Ichimoku indicator . As you can see, the price is above the 9-day moving average and the 26-day moving average . Also, Ichimoku Cloud, Senko Span A, and Senko Span B are above, and Chico Span is also above the price.
If you are not familiar with this metric, please refer to yesterday's video . I explained it in more detail . You can also see that the 200-day moving average line is rising slightly . Overall, both the weekly and daily charts are showing a good trend . However, there is one important point. If you display the trend line, you can see the 6133 level.
If we look back at the May 18, 2026 candle, it is still right below this resistance line . Please keep this in mind. We can gain confidence that this trend will continue only if it breaks through the 6133 level . It is on an upward trend. We are looking at the Hanging Man pattern now . Do you see this red candle?
I'll zoom in and show you. Yes, it is the Hanging Man . If a candle like this appears after a rise, there is a possibility that it will fall slightly within the next day or two . However, there is a strong support line in this area . This is the key. I will briefly show you the Hanging Man pattern .
If you scroll down on my website (x.com/bluecloudtrader), you will find a candle reference table at the very top . Click on that, and then look at the bearish single candle pattern item. Here is the Hanging Man . Do you see a candle like this after the rise ? It is a candle with a long tail and a short body .
Right? This is also a reversal candle. It does not necessarily mean that it will fall, but it means that there is a high probability of a fall . It makes sense to some extent since it is at the resistance line . Of course, everything will depend on the news . So, I might definitely break through level 6133 tomorrow .
However, I am saying that it is advisable to be more cautious when observing such movements . How about SPY? Looking at the weekly chart, it is showing a sideways trend . It has been moving sideways for quite a long period of several weeks . The S&P 500 index is not showing signs of expansion . Rather, the atmosphere is one of waiting and seeing.
I think it will become clearer which stocks will perform well once the election is over . And another point to consider is that earnings announcements are still in progress . Therefore, there may be some changes in that part as well . On the weekly chart, SPY is consolidating, and on the daily chart, it is showing a retracement, staying just above the Ichimoku cloud but below the 9-day support line .
Therefore, since it is not a blue flag, it does not appear to be a bullish signal. There is something strange visible in both the weekly and daily charts . What about the QQQ ETF? As you can see, it has been showing a continuous downward trend since breaking below the 9-day support line on October 12 .
Since then, it has actually fallen by 4.3%. It is currently hovering near the cloud support line but is below this trend line . Do you remember this trend line I mentioned ? It broke below this trend line on September 21st, then broke below it again, and has remained below it until now . It has been below that for 3 consecutive days .
Therefore, there is no need to get too excited. Actually, QQQ fell 0.1% today. The Dow Jones Index rose 1.05% but remains below the cloud, which is in bearish territory. At this point, it would be best to hold off on buying the Dow Jones Index . Looking at the weekly chart, we see much more interesting and bullish movements.
Everything looks good on the weekly chart , but I am not very optimistic about this directional movement . Looking at the index, the red line is still above the green line and the ADX is falling, which means that uncertainty has increased, at least in the directional movement indicators . The Russell 2000 index fell.
Both moving average lines are below, but are at least just above the 270-36 level . This is an important part . I like this point . Looking at the daily chart, we are still in a downtrend channel . As I mentioned earlier , it is not a good idea to add positions yet . It is positive that it has been consistently maintained above the 270-36 level for at least the past 5 days .
I will see how much longer this level can be maintained . This level is important because it is a significant reference point going back to April 29 and May 29, 2026 . 19th, 2026. Yes, the price found a support line there twice . And it has been looking for a support line for 5 consecutive days now , which is very interesting .
It might rebound, but it would be best not to jump in until it does. The VIX index fell 6.13% . It actually looks like it has re- entered the cloud realm, but it has n't dropped significantly. We want to see the VIX index (volatility and fear index) fall. Eurozone stock markets are still on a downward trend.
Although it rose 0.77% today, you can see that it is inside a descending channel on the daily chart . Gold is also in a descending channel on the daily chart. Silver is also falling below the cloud . IBIT, a Bitcoin ETF, appears very bullish on the daily chart . It just broke through the 9-day candle again .
It rose by 0.89% . Therefore, if you are engaging in short-term trading, please refer to the daily chart . all right. An upward trend is visible. However, the weekly chart has not yet fully entered an upward trend . As you can see, the price luck is still within the cloud . The fact that the price is inside the cloud means it is in a neutral zone .
It means there is no upward trend yet. An upward trend has not yet formed, and neither the highs nor lows have gotten higher. Ah, wait a minute. The peak was slightly higher than the previous peak. However, the low point is lower than the previous low point . The low point has not risen yet. It seems more reasonable for this level to be broken through only after a correction occurs.
yes. Shall we take a look at some other things ? There is an Ethereum mini ETF ( ETH). You can see that it is still below the cloud on the weekly chart . This indicates a downward trend . On the daily chart, it is above the cloud, but below the cloud. Look at the moving average line. The 26-day moving average is still below the price .
It's the lagging moving average line . So, I will wait a little longer . What other sports are there? There are 23 stocks and ETFs mixed here . The top 5 stocks and ETFs are showing significant strength in both periods . Shall we start with Apple ? Looking at the weekly chart, the price is above the cloud moving average line but below 344.57 .
This figure is based on the July 31st candle . It has not closed above that high point yet. What about the daily chart ? As you can see, it is moving just below that level . Therefore, it would be best for Apple to put it on hold for now . TMO, or Thermo Fisher Scientific, looks good on both the daily and weekly charts .
I like this stock . West Pharmaceutical's services are also good. It broke through the 386 level on the weekly chart . However, this candle is still forming . You have to wait 3 more days . The price will close. We will know what the price will be on Friday. It looks quite good for now . It is at least above the 386 level and traces back to the July 23 high .
The next resistance level is 415.73, leaving about 6.5%. The next resistance level is 475.35, leaving about 18.29% . Therefore, there is a possibility of an increase. These levels were calculated based on the monthly chart . The part marked in purple is the monthly level . I will change it so that it is clearly visible .
Now, let's go back to the past . The peak here is around 2021, and the peak here is in 2023 . Therefore, you must break through these levels. The XLE indicator looks very good on the monthly chart . This is an energy indicator . Check the energy on the monthly chart . It also shows very strong performance on the weekly chart.
The daily chart is showing very strong momentum . However, as mentioned earlier, in the case of other oil K charts, as you know, a Hanging Man pattern has formed, so there is a possibility of a correction. However, at least it has formed a higher high than the previous high , and there is no resistance line above it.
XLV is a healthcare sector ETF, and it appears to be quite strong. There was some hesitation over the past three days, but it rose 2.37% today . Therefore, the upward trend is expected to continue. The Directional Moving Index (ADX) is also showing strong performance . Even when looking at the weekly chart, it shows strength in the same way .
The remaining stocks have something technically odd about them . I will show you the chart . I have already reviewed it . However, I do not recommend buying more of these stocks . I will not even consider it. It's not too early yet. Of course, some stocks may outperform others and could be added to your watchlist, but it would be best not to invest in them for the long term just yet .
If you look at Amazon's weekly chart, the fast moving average line, or conversion line, is below the baseline (Kijun-sen). It's based on the weekly chart. Therefore, the flag-shaped pattern does not appear. On the daily chart, it is above the cloud, but the future cloud is in a downtrend. How can I tell if the cloud is on a downward trend?
In Senkou Span A, the light blue line is below the purple line . Let's go back to Amazon, no, XLV. Do you see the light blue line on top of the purple line ? This is exactly the kind of thing you need to find . This line predicts 26 periods later, and the subsequent line predicts 26 periods earlier.
The white line is an indicator showing the current price and the price of the candle from 26 periods ago . Yes, the same applies to Amazon, but not everything goes smoothly . If you look at the daily chart of BlackRock (BLK), a bearish cloud has formed. So I will not buy right now . Core Vivint (CRW, V) is a stock that has been mentioned a lot recently, and it is holding its ground once again above the 60.55 level .
The interesting thing today is that the price started below 60.55 and closed right above it . There was a previous support line, right? So that support line is holding up the price . Simply put, that level is supporting the price . Let's look at Google. Google is below the cloud on the daily chart and is below 200.
So I will not buy. It fell by 1.13%. Tom Lee's Granny Shots U.S. Large Cap ETF (GRNY) is similar, isn't it? It is under the cloud band . So, that's why I wo n't buy your shots right now either. Well, on the daily chart, LYV (Live Nation Entertainment) is also below the cloud. It has been showing a slight upward trend recently, though .
I see a positive crossover. The fast moving average line has risen above the slow moving average line. So there is a possibility of an increase. The lagging moving average line has moved above the price . However, the cloud is still on a downward trend . Therefore, Live Nation does not recommend it .
Microsoft is above the cloud and the 26-day moving average line on the daily chart, but below the 9-day moving average line . Looking at the weekly chart, it is showing significant strength. Microsoft is worth adding to your watchlist and waiting . If you wait just one day and it breaks above the 9-day moving average again, there is a possibility that a bullish signal will appear.
NVIDIA is still in the cloud on the daily chart . It is moving in the neutral zone, near the low point. I will hold off on Nvidia. RKT is still inside a descending channel , below 200, and below the downtrend line. Cloud. No, I will decline Rocket Company at this point . What else is there? There is SMH.
It's a semiconductor ETF. I'm still holding out above level 537.79 that I drew recently . Looking at these levels on October 16th, I liked the fact that it is maintaining this level and holding above the downtrend line . After breaking through, it finished right on top of that . However, since it is still below the cloud on the daily chart, I do not recommend buying more.
If you look at the weekly chart, both moving average lines are below. Still, being on the cloud is a good sign. SPLV is an S&P 500 low-volatility portfolio . This ETF is doing quite well . It rose 1.32% and broke through the cloud for two consecutive weeks . As you can see, last week it started with a downward trend after closing , and yesterday it started with a decline.
Let's look at the daily chart. You can see that it went down to this level yesterday and rebounded today with a gap up . The problem with SPLV is that a downtrend cloud has formed on the daily chart . It would be best to hold off on this stock. Spotify is in the cloud. It is a neutral movement on the daily chart .
I do not recommend this stock. Tesla is showing an increasingly upward trend on the daily chart. Today, the price broke through the moving average line, but it is still below the 200-day downtrend line . How far is it from the 200-day moving average ? It has dropped by about 3.2% . If you look at the weekly chart, it is below the cloud .
I am not interested right now. Let's take a look at other stocks. There is TWLO . This stock is below the 9-day candle on the daily chart . Let's see how it is . I held this stock from September 21 to October 6 and then sold it. We made a profit of 19.3% . The deal was shared with Legend level members on Tuesday, October 6.
If you are a Legend Level member, you can view this post . Consider signing up for a membership . Simply visit my channel, Blue Cloud Trading, and click the 'Sign Up' button . And to view daily posts, please select 'Blue Cloud Legend'. You can also watch members-only videos on 'Blue Cloud Trader' . ' Blue Cloud Supporter' allows you to request stocks or ETFs that you would like analyzed in future videos .
Just like the four stocks I will analyze today . Now, let's take a look at TWLO first. First, let's look at the weekly chart. On the weekly chart, it still needs to go above the 9-day moving average line . A strong Harami pattern is forming. great. On the daily chart, it is still below the moving average line.
Therefore, it seems that TWLO will not rise at this time . Hmm, it has broken through the cloud band . The situation today is quite interesting. UNH (United Health Care) looks attractive, at least at this point in time . Breaking through the high point is also a good sign. However, it has not yet formed a higher low .
Everyone, take a good look at the low point here . It has not yet formed a new high or low due to a retracement . Now, interesting movements are visible on the daily chart. I also like that ADX is rising . But what would it look like if I switched to a weekly chart ? Except for a few exceptions, most are on an upward trend.
First, personally, I do not recommend buying more now because the short-term moving average is below the long-term moving average . There is a 200-day moving average line right above, and there is a difference of about 6% . Yes, that is correct. However, the fact that it is at least showing strength is positive.
Starting from the low point in April, it has actually risen by more than 60% . The weekly chart for the tech stock ETF XLK is still in its second week. It is not good to go below the 9 period . It is below this resistance line . It is within the cloud on the daily chart, so it is in a neutral position.
Therefore, it is advisable not to buy tech stocks at this time . It seems that will be the case, at least for the time being, probably until next week. XLP (Consumer Essentials) appears likely to form an upcloud in the future . The price is above the cloud, and the short-term moving average line is above the long-term moving average line, so it is a good signal on the daily chart.
However, there is a red spinning top candle. It is recommended not to buy XLP because of this candlestick . If you look at the weekly chart, there is a green line below the short-term moving average line . What is the other category? XLU is below the cloud on the weekly chart . Therefore, utility stocks are in weak territory.
Likewise, it is below the cloud on the daily chart as well . However, at least on the daily chart, it is showing a slightly stronger performance . Then, let's take a look at the members' requests. Let's start with HLT first. For your reference, there have been requests for other stocks, but since those are stocks included in the Blue Cloud portfolio , such analysis is provided only to Blue Cloud Traders and Blue Cloud Legend level members .
So, I cannot show you in this video, but I will analyze it for you separately over the weekend. Now, let's take a look at HLT, Hilton Worldwide Holdings (HLT) . It is the accommodation industry, which belongs to the cyclical consumer goods sector . It looks good. I am currently viewing Hilton positively .
Looking at the daily chart , the price has broken through the 358 level , and this high was formed in June of this year. Was it June 16th ? Ah, was it the 18th? Ah, it was the 17th. June 17th, do you see the Shooting Star candle over there ? Today, it broke through the candle . The ADX index is also showing an upward trend .
I like what I see right now. How is the weekly chart? The weekly chart also looks quite good. It's good that Ten Kansen is trying to break through the baseline right now. It is at exactly the same level, 330.20 . My biggest concern is whether the candle can hold above the 358 level on the weekly chart on Friday afternoon, specifically around 1 PM, 2 PM, or 3 PM.
If it falls below 358 in the coming days, it is highly likely that a double top pattern will form. The double top pattern is not a bullish pattern, but if it holds above 358, it seems likely to provide additional confirmation. Now, let's take a look at T T W O Take-Two Interactive Software. This company belongs to the field of electronic games and multimedia.
It is currently below Ichimoku Cloud on the weekly chart . The same applies to the daily chart as well as the weekly chart . Therefore, it would be best to hold off on this stock. Take two. CLGN, let's start with the weekly chart. Coloplast Biotechnologies Limited is still under the cloud. It belongs to the biotech industry .
It is below Ichimoku Cloud not only on the weekly chart but also on the daily chart . Therefore, it would be best to put this stock on hold as well . Let's take a look at AIG . Let's start with the weekly chart . The good news is that we have broken through the cloud over the past few weeks . However, the problem is that the cloud itself is still on a downward trend.
As long as a single span A is below a single span B , this can be considered a sideways section. In other words, the price is trapped within this range . And you will want to see these highs broken through much more significantly . In particular, Section A must definitely break through Section B upwards.
I also view the formation of a support line at the 200 line on the weekly chart as a positive sign. 200 is the weekly moving average line. Even on the daily chart, the price appears to have risen significantly from this level . When the price drops this far from the moving average line, a correction is expected.
You cannot maintain such upward momentum for a long time . A depletion candlestick, shooting star, reversal candle, spinning top, etc. will likely appear . If you hold a position in this stock , it would be advisable to consider taking partial or full profits right at that point . Now, everyone. That's all for this video.
Thank you for watching. Thank you for subscribing to the channel , and I will see you in the next video . Ichimoku's guiding light. Blue clouds are sailing all night long .


Comments 0