저자: CharlesMoon · 외국인
요약 보기
구글(GOOGL) 실적은 강하나 설비투자 부담으로 주가 급락(약 7% 이상), 200일선 322 이탈. 찰스는 단기 풋옵션(315, 7/31)으로 305 목표를 제시. SK하이닉스는 메모리 수요 강세로 ADR 185 콜(7/31, 12.5 이하 매수) 제시하며 177 돌파 시 상승 기대, 170–166 이탈 시 손절. IREN은 43.5 저항 돌파 확인 후 44 콜(7/31, 3.75 이하)로 200일선 48–49 목표. 기술적으로 구글은 305, SK하이닉스는 155·149, IREN은 36 부근 지지 확인.
다듬은 글
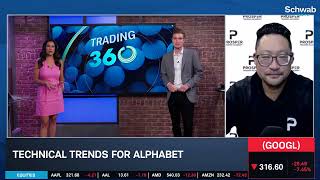
Welcome back to Trading 360. I'm Marley Caden. Time for the "big three." We have three stocks, three charts, and three deals for you. Alex Coffey is with us today to break down the charts. And Charles Moon, a stock strategist at Prosper Trading Academy, will help us analyze the deals. Charles, we're happy to welcome you to our show.
I saw when we were setting up the camera that your puppy was nearby . So if your dog wants to join in, we don't mind—let's call it the "big four," even though you only have three options. But let's start with some thoughts on the market situation we see today. I mean, the day seemed a bit stormy. Oil is above 90.
10-year bonds are now at 4.71. The dollar is over 101. The yen is in its worst condition against the dollar in 40 years. How do you look at all this? Well, you know, this is exactly the environment we're seeing right now. And you know, again , my dog ran away. My students and clients have aptly named him the " rally dog," and he's having a pretty bad day today, as you can see.
And this is simply a consequence of the market environment. You know, so far in July, Thursdays have generally been the weakest days of the week. We are still dealing with unrest in the Middle East and rising gasoline prices, which raises concerns about inflation and Fed policy; essentially, when this drama and war in the Middle East ends, this will be the next thing we will have to face.
What impact could potential inflation have on our economy? And you know, markets just fluctuate back and forth . We see companies like Google reporting incredibly strong fundamentals, great forecasts, and significant growth in advertising revenue. Sure, AI services for businesses with Gemini and cloud revenue skyrocketing 82% year-over-year , but they're being penalized for capital expenditures— that's life.
Everything is now viewed in the short term, and that is how we should perceive the markets. Good. So, as we look at Alphabet in the short term, I know it's your first pick in the "big three" today. Tell us how you approach this given the downward movement. I mean, we're down seven and one-third percent now.
Yes. And again, you know, it's unfortunate because they've increased capital spending per year up to $25 billion. You know, I've been watching the 200-day simple moving average very closely at 322. If they could hold, I'd like the calls. Today they lost her. In fact, they immediately found themselves under pressure.
So I'm looking at put options 315 on July 31 . At the time I thought 420 would be a good price. It's a little higher than her. You know, you don't need to take too many risks. You risk 30%. And as stocks fall, they could fall to 305. This is a closing price gap from April 7th, which was the day before the market exploded and began an extremely bullish rally for several months.
So I think if the price quickly drops to 305, you can make a profit of about 150% or higher. You know, the sooner this happens, the better. And that's where they're headed now. Okay, Alex. So, looking at Alphabet's chart, we can say that high hopes were placed on these figures , but the reaction was quite negative.
What do you see from the technical side? Yes, the first thing to note is that 200- day moving average that Charles pointed to. We lost it this morning, actually opened at that level and were unable to move significantly higher. So that's something to consider when looking at level 305, which he mentions as a potential target.
It would be somewhere in that area. We are already dangerously close to this goal. I set it up a little differently today than I did yesterday. It's more about how I think. I love color coding. This simplifies things. We look at so many different stocks. That's why I like the traffic light analogy. Red light is resistance.
The yellow light is a kind of turning point. If you're right next to it, you can skip ahead, but if not, you need to slow down. Of course, green is support. This is related to some of the levels we saw at the beginning of the year. This chart only covers the period from April 1, but the key turning point here was precisely the growth target that Charles was talking about.
If you can get back to that 200-day moving average, which is now around 323, then it is centered around the 335 mark. So, 335 is a short-term resistance point on the upside. 305 is Charles' target for the downside, and real support is around 275. So we're seeing a huge move today, judging by the latest data.
Let's take a look. The shares fell about $25 a share. Well, quick calculation: $12 billion per dollar of price. We're talking about $300 billion in market capitalization lost today by Alphabet alone. My favorite rough estimate is a hundred billion dollars in market capitalization. That's slightly less than Starbucks' market capitalization.
We see almost three full market caps of Starbucks wiped out today. Marley, I... I mean, this is incredible. I like how you put it in context so we can appreciate the significance of these movements, because sometimes it's hard to understand them when we just talk in percentages. But I want to move on to your next choice.
This is not an option that we have already presented in the "Big Three", so I am glad that he is with us today. Charles, you have SK Hynix here . Does this have anything to do with the reaction we're seeing from Google? Yeah, you know, honestly, when Google reported earnings and then during the conference call, we saw that Micron and SK Hynix really performed very well .
SK Hynix actually had more news, and the stock opened in the red while the market was in the red, opening down almost 500 points. Therefore, there is a high demand force. Of course, this will be very sensitive to what happens with the KOSPI index in South Korean markets. You know, we saw extreme volatility there.
I think they're on their seventh or eighth trading halt for 2026, and you know, this name, along with Samsung, usually makes up, I think, 55% of the total market cap and weight of the entire KOSPI index. So this is an extremely powerful company. But, you know, with Google on their calls and especially talking about costs, companies like AVGO are benefiting from this news.
Memory manufacturers will definitely benefit, and being powerhouse players, Micron and SK Hynix were two names that I felt would stand out the most. So, if we are going to work with SKH Highex, I like the uptrend. Again, I prefer short-term trades due to the current state of the market. I am considering call options with a strike of 185 on July 31.
They are extremely expensive due to volatility and expected volatility. Therefore, I plan to target these contracts at a price of 12.50 or below. Again , I set a hard stop at 30% due to technical levels. I would hate to see them fall below the 170–166 range. But if they can stabilize and hold here, I believe they can bounce above 177, which is a key level.
It seems like they even exceeded it today or were simply protesting. This was a small gap closure, and if they break through this level, I think they can get back to the IPO high or start to break higher. So I think memory is something that is playing a role in the AI sector right now, or at least something to watch in the near future through the reports of these hyperscalers.
Okay, Alex. So, looking at SKH's ADRs after their IPO, do you see us getting closer to that IPO price? Well, it's worth saying that we don't have much data to analyze. So there are no real indicators, but here are the price dynamics. Each candle represents one hour. The same visual cue as a traffic light.
So, the first thing to note is 170. That's about where we're trading right now. This is our point of reference. As you can see, looking at the chart, the level has been tested over the past few days. It was also a fairly relevant level before, considering last week. So , again, we only have a couple of weeks of bearish trading.
If we lose this level, which we are trying to do now, the support zone I am looking at is around 155, and below that is a critical level around 149, which of course corresponds to the IPO price or the placement price of SKH. Charles mentioned 177. That's within that range. We tested it today. At least for now, I haven't been able to hold back.
And then I look at 185. Yes, the highs were around 190, but peak values are not always resistance points. What is more important is where real supply begins to accumulate. And as you can see here, we spent a few hours hovering around the 185 level. For me, this is a target for growth and a resistance level above 177.
So, SK Hynix is currently trading in the positive during the session. We grew by about 1.75%. We are at 168.19. for this company's ADRs. Now, looking at Iron, we saw a very nice jump. I think it's about 20% up after the announcement of the new contracts. But how do you rate Iron now, Charles? And how would you trade this asset?
Well, this will be one of those ideas that has to prove its worth. Again , I think the data center sector, especially after Google announced how much it spent in the last quarter alone on building them, will definitely benefit from the Google news. And again , that's kind of the main theme here. You know, we saw Iron and IREN initially go up this morning, but then they kind of pulled back a little bit.
And this is a key factor. IREN has hit key resistance near the 43.50 mark. So, essentially, I'm waiting for a breakout above this level. I'm not just waiting for a breakout, I want the price to consolidate. So this is a kind of confirmation and verification. But I believe there could be a very short-term bullish push straight to the 200-day moving average, targeting the 48-49 range.
So if the price breaks out and holds, I will buy strike 44 again. Short-term options, July 31 call options with strike 44 at 3.75 or below. This is a little more of a risk. I'm taking a 50% risk. I believe that the profit will be 80% or more. Of course, if it breaks through that 200- day moving average, it will be able to gain and really sustain momentum.
But at least for now, this will be one of those ideas where I just try to take advantage of a small window of profit if the stock truly demonstrates bullish sentiment and buyer demand. Okay, Alex. So what do we see here in the settings for IR? Do you see the potential for some bullish moves? Well, first of all, I really have to point out that the same situation is happening here.
This has been going on since April 1, but it is a volatile asset. So, when you look at the INE, think of these lines more as zones. And despite the 43 and a half that Charles points to, I think that's a great area to consider as a kind of turning point. So this was essentially an area that had remained a battlefield for the past month .
So this remains relevant even now. We tested it yesterday, unsuccessfully. We tested it this morning, unsuccessfully. So keep an eye on this area as this is a very key infrastructure- as-a-service company in this AI discussion. I like to look at these support and resistance zones. Again , I said they are colored, but I also view them as equidistant.
It's not really that clear cut, but you can still see that if you add, say, $7.5 to the upside, you get 51. This 51 level has been significant several times over the past few months of trading. So when I see that, it looks like an area that could be important again. You will also see several indicators on this line here.
One of them is the 50-day moving average (SMA). This is the same TL line. It is converging towards the 51 level as we speak, as is the 200-day moving average, which is just below. So they also give some weight to this potential target area for growth. Now, in terms of the decline, you can look here, going back to the lows of the last few months or even the most recent lows in this mid-30s zone.
I have 36 here. That's $7.5 below that pivot point, but we're actually talking about the mid-30s as a potential support area, Marley. OK. So, somewhere in the mid-30s, we're now at 40.95 for Iron. We are trading down about half a percent this session. Charles, we really appreciate you being with us on the Big Three today.
Maybe you should give that dog Rally another pat so we can try to fix this situation. But Charles Moon, thank you for your time, and Alex Coffey for breaking down the technicalities for us.





Comments 0