
저자: TomLee · 외국인
요약 보기
Tom Lee은 인플레이션 둔화(중고차·보험 등)와 기업이익 상향(2025년 EPS 275, 2026년 약 280)을 근거로 S&P500 연말 목표(5200 상향 필요)를 제시했다. 현재 밸류에이션은 forward PE 약 21배지만 중위 PE는 낮아 중소형·가치주 확대 여지가 있다고 봤다. 다만 Carl Quintanilla 진행의 차트 분석에서 Zeb Fields는 S&P500·나스닥이 주봉 45주선에서 멀어져 수주~한 달 내 조정 가능성을 언급하며 신규 매수를 보류했다. Dow와 Russell 2000은 상대적으로 건강하다고 평가했다.
다듬은 글
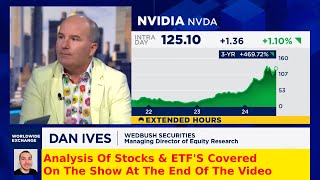
5500 number but it doesn't necessarily reflect how you you think the year is going to end are you going to take a look at your your end year end targets now uh we are Carl at this early December last year we thought S&P could reach 5200 this year which at the time was almost uh a 20% gain we've obviously moved well above it and the fundamental picture to me looks stronger I think earnings next year we originally thought would be 260 for 2025 it's probably closer to 275 I I think the war on inflation has been meaningfully better in terms of progress I know there was a lot of dispute but I think the last two inflation reports and the fact that 55% of inflation components are back to pre-pandemic levels means inflation's really going to fall like a rock these are factors that get give us comfort that multiples can expand and so I think 5200 is clearly too low um but I don't know how much above 5500 there is into your end so I think in a cple weeks we'll be addressing that you actually use a graphic of a Falling Rock in your charts to describe elements of inflation that you think are dropping you said we're beginning to see insurance is a break uh waiting for shelter to follow suit some of your forecast U Tom on new cars and used cars do you actually think we could see that kind of deflation uh yes I I think it you know one thing to keep in mind is that there's almost 290 million cars on the road today so um when you know used car prices fall 10% uh and they and they're continuing to fall that's a meaningful amount of disinflation and it may be painful for people who've borrowed money to buy cars but that is also you know saving people who are buying cars and so I I think there's a lot of goods disinflation in the pipeline and especially with new cars you know inventories have really been picking up the cdk cyber security hack might sort of disrupt it short term because there's a shortage now of new cars available but I think the trend for new cars is also lower so Tom what happens to our earnings estimates in in this environment I mean I get that it's good for the market if inflation Falls and the FED starts cutting rates maybe that that trumps everything but if the economy starts to really weaken and these these forecasts for Q2 are coming down then what about the earnings picture well it's uh you know first of all there's always winners and losers uh there's a lot of companies in sectors that have no correlation to inflation technology is one example uh and there's many groups highly correlated to the rate of inflation like basic materials and energy um we're not talking about overall inflation going negative it's actually that it's going towards 2% so there's still plenty of companies that are getting priced and as you know the biggest pressure on many companies margins has been wage pressures that's cooling a lot and gasoline's Cooling and that's really helping consumer wallet so I I think it's pretty complex but to us if the global economy is picking up and earnings delivered have already suggested 270 for 2025 I still think we're maybe going to be closer to 280 next year Tom if markets tend to lead the fundamentals and we've run up here uh you know to let's say 21 times forward earnings why would improved earnings relative to expectations now lead to multiple expansion uh you know on top of what we've already had uh it's a fair question um it's really the composition of what contributes to the gains because if you look at S&P forward uh it is high I I think forward earnings multiple like 19 but the median is 16 and the median PE in the Russell 2000 is actually 11 times so I think that there are going to be many stocks that can rate towards 20 but the the Pees that are many stocks that are at 27 PE I mean they could increase in their multiple but I think there will be a lot more juice in the 16 multiple going to 20 then there is 27 going to 28 hey finally Tom uh 5 days in a row uh S&P headline index and breath have diverged we haven't seen that kind of streak since the late 90s are we going to start assembling lists of analoges to the late 90s and is that a good thing uh Carl you know uh you know the late 90s didn't end well so uh I I think if if this is going going to look like the late '90s then investors do have to be really preparing some portfolios that are appropriate for that and that you know that in the '90s late 90s that meant to really be patient with value and then of course be ready to exit uh the high momentum uh I in some ways I think the skepticism that exists today because you know I I was an analyst uh starting in 93 so I saw the '90s there was a lot more abulance back then and a lot more uh people who didn't think stocks could ever go down I think there's a lot of top callers today so for me this this feels a lot more midcycle and I know it sounds surprising but there's just too many top callers especially among our institutional clientbout the S&P 500 the NASDAQ the Dow and the Russell 2000 so I'm going to briefly break down those stocks recently the analysts have been making a lot of long-term calls so I thought we'd take a step back and make every single bar one week instead of one day so this is the 4 5 we moving average in blue and the 200 we moving average in green so right off the bat the S&P 500 you can see we've been on an amazing run and now we're starting to look topheavy we've had two consecutive weeks with topping Candles now showing that we tried to go higher and are now getting rejected you can also see that we've got quite a distance to that 45 we moving average and the 200 we moving average you can see many times in history we've come back to the 45 and the 200 we moving average that does not mean that the trend is over that just means that we need a nice healthy pullback because the Run has gone on too fast or for too long that's kind of where we're at right now guys I think we need a sideways consolidation at the very best to maybe even some type of pullback Because by the day we're getting farther and farther from these moving averages which we all know the farther we get away from them the faster we're going to come back to them so I'm not putting any new money to work right now I think we're going to have a pullback in the next few weeks to next month or so on to the NASDAQ you can see we've also had two consecutive weeks with topping Tails so we rejected going higher we are still a huge distance off that 45 week in the 200 we moving average guys we touched them not too long ago and we've gone on such a strong epic run that it makes sense that we need a little pullback at very least we need to start going sideways a lot of these broad Market ETFs are going to need the same exact type of pullback they've been incredibly strong this year here's the Dow Industrial Average it's holding that 45 week a lot closer you can see the Gap is a lot smaller so this one's actually looking pretty healthy it's holding those 45 we moving averages the long-term moving averages the gaps are not as big as the S&P 500 or the QQQ we also have some very nice support that was resistance back here if we do keep falling back in the 370 level somewhere around there but guys this pattern is looking very nice and healthy the Dow Jones Industrial Average moves a lot slower than the S&P 500 and the NASDAQ but nonetheless it's still consistently grinding higher and those long-term moving averages keep up so that means there should be a lot less downside if we do start to head down the Russell 2000 small caps have been everywhere up down up down major major moves but we basically been in a channel for the last several months and now we've been working our way out of it to the high side we're making the high side of this channel a nice support Zone you can see we've come back and touched it almost to the penny right here and we're going back to the high side I think this is looking pretty bullish we also have the long-term moving averages catching up nicely and supporting this move so the Russell is actually looking the most long-term bullish out of all the charts right now I hope you guys enjoyed the video in e


Comments 0