
원문 보기
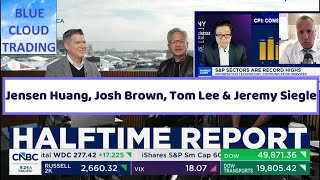
Trading in Blue Cloud shares continues overnight. Welcome back to the channel, friends. I'll turn on some CNBC segments in a second. I'll open the charts, delve into technical analysis, and see if the price action actually confirms what the experts are saying. Subscribe if you haven't already , and let's get started with the first segment.
Karl, thank you. Welcome to Break Report. I'm Scott Wapner. This hour's focus is why one prominent market strategist says the much-discussed AI-related stock trading will soon resume. We will discuss and analyze this forecast with the investment committee. With me this hour: Joe Terranova, Carrie Firestone, Jenny Harrington, Steve Weiss .
Check the markets. We are all in the black. Yes, SpaceX is helping, as is Super Micro, and here is our prediction. Ben writes us a review of Melius with a positive outlook on what this optimism means for other companies. It all adds up to a pretty good day. Scott Rubner of Citadel Securities says: “ Everyone uses the midterm elections as a threshold for risk reduction, and I think that’s when AI can perform best again.
Our clients' feedback is: "We are willing to buy at a higher price, but not now, when a major political event is brewing ." This really matches what we were talking about, you know, you look at me with disbelief. Where's the pat on the back, Scott? Yes, that's exactly it. You should have seen that look.
I mean , he was incredulous when I said to a well-known strategist, " So, am I going to invest in semi-truck stocks tomorrow or at halftime? If I add semi-truck stocks, because I think tomorrow I'll add semi-truck stocks." So Kevin, I'll let you know and I'll invest. I want to invest in AI related stocks.
I want to invest in AI stocks because everyone is running for cover. They rushed to hide, and their position is incredibly weak. This is the hedge fund community. It is a community of portfolio managers who work with mutual funds. They've gone into hiding, and we see that there will be a rebound in profits, and they'll have to quickly rebuild their position in early November, and you see...
Optimism is coming back, and we're finishing 2026 very strongly. I want to trade using AI. I want to use the momentum factor. What about you, Kara? So , you see it the same way as Terranova and Rubner? A Medium-Term Risk Event and a Return to AI Trading? Well, I'm not sure I see it as well as our wonderful market strategist just described.
I think we had a bit of a setback. This is a kind of re-test of whether our financial results are good enough, which we will start with this evening with Meta over the next week to show whether they deserve the confidence of investors on a large scale. Remember, we're talking about a $30 trillion market cap across the top 10 S&P companies.
And if you change that by 10%, a lot of money will come into the market. It's not like a couple of funds trading stocks. We need big market moves. Many people also add to Investors who have invested in a 401(k) are happy to hear what they hear. Will we hear good news? Well, we'll find out tonight . We'll likely hear that the news has had a positive impact on Meta and increased interest.
I'm not sure this will lead to increased profits. We'll hear about capital expenditures , which are a major factor holding some deals back because they spend so much and it eats up all the cash flow. But P/E ratios have fallen. The only major company with a P/E ratio of three is Apple. Nvidia is in the 10-20 range, Google is in the 20s.
They've all fallen to reasonable P/E values in this market if we hear good results in the next 10 days. You know, Weiss, you've become a little more cautious, I think you mentioned it the other day when... So. You have significantly reduced your position in AI-related stocks . Do you disagree with Joe and Rubner from Citadel Securities?
Yes, because I don't think it's that simple. It's never that simple. With all due respect to House Perlman, who looks into the future, I have noticed a decline in the share price. However, to say in general that everyone is running away from these deals is simply not true. And I know that it needs to be clarified that this is exactly what is happening.
I think there has been a rationalization of positions in terms of size and concentration. I also think there has been a rationalization in terms of the quality of companies you include in your portfolio. Do you want Coreweave or Nvidia, which sells for 10 times more than next year on January 28th? I think that's exactly what's happening.
I don't think you're going to see ... Clarification of the situation will happen by the election, because if you want, you'll want to watch how Anthropic does its IPO. You'll want to look at what happens with interest rates and funding, with cyclical funding, and where the weaknesses are there. And this will not happen before the elections.
If you look at Cal Cunningham and others, the election is already a fait accompli. Democrats will take control of both the House of Representatives and the Senate. So you see what's happening with defense stocks. So the point is, look, I keep saying this, I'm not saying that AI stock trading is over.
I'm just saying that not all ships are floating right now, and you have to be careful what you invest in. So I would rather invest in companies like Meta, Alphabet, even for that matter , you said the other day that even with the stocks that you like, you've cut almost all of those positions, right?
That's what you said. I didn't say that I reduced the number of transactions. I sold Vertiv. I sold other companies too. But Meta...no, I said it's still one of my largest positions. It remains a Taiwanese semiconductor company, except for a layoff about six months ago that turned out to be a mistake.
You know, she's not that far from here . This is my largest position. So I'm still there. I'm just focused on companies where the valuation supports what they do and that are on the other side of the capital expenditure cycle with products. So look, I prefer to see cash flow. That 's why I look at the EBITDA multiple.
I'm looking at Nvidia's EBITDA multiple right here, which is 10x next year. You don't have an EBITDA multiple for CoreWeave. You don't have it for Anthropic. You do n't have it for OpenAI. What are you doing? Have is Anthropic says, "We need $750 billion in funding in the next few years alone." " So I avoid these companies.
I'm not saying they won't grow. I just prefer to avoid, you know, the hype around high momentum and stick to what will be sustainable over the long term, over multiple cycles. Jenny, I'll contact you now. Do you want to say anything in response to this because it sounded like an attack on your point of view.
Vertiv? Cloud services, GE Vernova. I'll be very specific. I don't think they have a high beta, Steve, in the context of the AI market. KLA Corp, Lam Research, Marvell, Corning, Micron. I don't think they have a high beta in the context of the AI market. This is not a beta coefficient. You said high beta coefficient.
Well, I'm saying that this is one of the conditions. Other— can I finish? Yes, sure. Fine. So, I want to tactically and purposefully allocate funds in the direction where there was a clear lag in the case of these three companies.” The industrial companies I mentioned grew by 10-12% over the last quarter.
You are seeing a narrowing of positions from retail and institutional investors focused on large companies. I do n't want major companies, I agree with you . I don't want major companies. I do n't want high beta companies because I think there will be a tightening of positions, which will further strengthen my investment strategy by the end of the year.
Right now the market is saying exactly what you are saying. We believe in the AI investment strategy. We believe that investing in AI is the right decision. We will narrow our positions towards high-quality companies. Now, the narrowing of positions towards high-quality companies means a defensively oriented company Mag Seven, he said.
This will expand as we move towards the end of the year. As your positions expand, you will see your positions grow. This applies to other large AI companies that have performed well but don't qualify as high-beta companies because they have earnings growth. These are the three industrial companies that I mentioned, these are companies that produce semiconductor equipment.
This is memory, and it is optimal. Lam will report this evening, won't he? Yes. Beta is just one thing . Okay, I don't throw anything out of the portfolio because of beta. That's for sure. Otherwise, I would n't own Moderna shares, which, as you know, have more than doubled since I bought them. I wouldn't own Vertiv stock from 45 to 240.
You know, that does n't scare me. But when I see the end of the cycle in terms of capital expenditure growth , and I see that in a year, right? The appetite for these companies that just have to spend, spend, spend will wane, right? And eventually this influx of capital from sovereign states, which were among the main creditors, and investors will dry up.
They also have position limits. Jenny, I'm sorry. I'll be quiet now. I just want you to focus on Vertiv for a second. So, you and I know, Steve. You will be back in Vertiv very quickly as soon as you see the price turn around and trade now. Once you see it start to grow, and it will grow in November, you will be in it again when it starts to grow.
Joe, I buy them when they drop. So why aren't you buying them now? They are high because I just made money from them. Quite low. I think they will... Exactly. Look at the rating. When I bought this company, it was trading at 15 times earnings. I don't know what she's like now. 40? But that doesn't matter because I think the hardest part here is growing profits.
You know, you mentioned earnings growth, Joe, and we need to see that , and that's where a lot of the skepticism comes in. That's why Micron shares are up 220% year-over-year but trade below 10 times earnings, because there's so much skepticism about whether they can actually sustain earnings growth.
And so even...When we talk about valuations, valuations that we can't rely on right now, we can't say, "Well, Micron is only worth six or seven times that right now." We don't know for sure. As for Vertiv, there is no volatility in revenue growth. Wait. Let me give you some numbers. It's a good company that benefits from the cycle.
But here's the thing. It's not just a cycle. This is a three-year period. Revenue growth over the last three years ...Let me finish. Vertiv's revenue growth over the past three years has been 21.67%. Revenue growth over the last two years is 26%. Over the last year—30%. Over the last quarter—24% . This is not extreme volatility.
In fact, it is a very stable growth. It's a cycle. It's a long cycle. It's a cycle. You think that in three years...Let me ask you this. Do you think...Micron is in a new cycle? Why is the world so strange? Why is the world so strange? Because we've never had technologies like AI. So why should it be weird?
Why can't he be really weird? We don't have a period in history where we can look at it and say, "Hey, this technology came along at this speed." Does this mean she is bad? I'm not saying it's bad, no one is, but I think by choosing Vertiv you're proving Steve's point, because I think what Steve means is that you can't make the statement, "I'm in the AI trading business ." "Steve, I'm sorry I'm explaining this to you in so much detail, but Steve's talking about adding nuance, right?
Because what happened this year is that investors' attitudes toward AI have become more cautious and prudent. That 's why Palantir and Nvidia shares are up only 14% year-over-year; Micron by 200%, and Oracle by 30%. Prudence came into play. So there are real reasons here, and there is real skepticism about the returns, and I think we're all sitting here.
There's a reason the S&P is now trading below its 10-year average multiple, and that's because there's enormous skepticism not just about Vertiv's earnings , but about everyone else's earnings. It's not just skepticism about Vertiv, it's skepticism about everyone else's profits." skepticism. This is not skepticism.
First, there were the political headlines, the belief that there would be a slowdown in data center construction. This was the biggest problem and therefore the reason for the low efficiency. You've seen many players fall by the wayside due to inertia . This doesn't mean we won't need equipment to generate power and cool data centers in the future.
There is nothing in the income statements to support your claims. This is the generalization you are making. This is the generalization you are making. Your generalization is that we believe that all costs will cease completely. This is not true at all. They will reach their peak. Like any other cycle, they reach a peak.
Do you think Micron is in a cycle, or will its growth simply skyrocket? I think Micron is in a longer cycle than history tells us. So the point is that it's a cycle. Cycles are defined by a start and then a peak. What I mean is that when capital spending starts to slow down , it's not going to go away.
Vertiv won't go bankrupt if you stop building data centers. But the point is that once the peak is reached, valuations peak and then return to reality. This has been true since the market opened, right ? Yes. To get back to the point that I understand we have a disagreement, you believe that we have peaked in terms of earnings, we peak in a year, and markets historically discount the year before that.
Yes, he doesn't say the peak has been reached. He says it's on our books, Joe. Our reporting is to buy high, buy even higher. Mine is learning from mistakes, part of hers is—wait a second. I say: buy high, sell high, just for reference. So what? Well, no, he says: buy high, buy even higher now. I'm giving you...
No, actually I'm acknowledging here that you're getting a correction opportunity in AI trading, and I want to... Take advantage of it. This is hardly a correction . I think 15% for a company like Vertiv is not a correction. They grew by 300%. But when Vertiv rises, it is not a correction. Absolutely.
This is not a blow. I had an argument on Twitter this morning with a guy who said, "Oh, you said that when the energy sector gets hurt, when AI trading gets hurt, then the energy sector should go down." And I answered him: “How naive, young and touchy are you to think that this is a blow?” " You know, like with a lot of these stocks, what does that mean?
Anyway, it's not enough. It's not enough. What happened last week is not a blow to AI stock trading . It's not . It's not enough of a discount. I mean, you're essentially doing the same thing I am . I'm suggesting that we're at the end of this mild correction, Steve. You're suggesting that this is the turning point and it's over .
I'm saying we ai n't seen nothing yet. Excuse me? I'm saying we ai n't seen nothing yet, and I think we all have that feeling, and all it can be is a feeling. We all have that feeling that we're somewhere near the peak. That we were somewhere near the peak, right? Who are we all? Who, who... We all seem to have that feeling.
And then there are those who are bearish. What do you mean? I think we're saying the market isn't moving. If you look at The S&P, it's been virtually unchanged for months. And the main drivers of the S &P are the hyperscale companies and those involved in this deal. The market is waiting. It's waiting for something, but it's fighting with those who believe there's going to be some kind of day of reckoning because we've spent too much too quickly, earnings growth and stock price growth have been too fast.
And with those who think, " Yeah, bears, this is a bearish scenario." So maybe you'll get some clarity. I'm going to deviate from what you were getting at. Well, not what you were getting at, but what you were already getting at because... Sorry. I was about to leave. Um, Meta, okay? Meta earnings report this evening.
Maybe you'll get some clarity from Meta this evening on Jenny, what our situation is. I mean, you've been pretty negative about the deal overall. So you must have low expectations going into Meta, right? No, actually, and that's... The point is, I think you can't just analyze the dynamics of the AI market, right?
You have to look at each company individually. And if we talk about Meta specifically, I do n't think there's any company that's doing AI better because , yes, they have a huge operating cash flow. They use it for data centers and everything else, but they're still a very profitable company. Their earnings are expected to grow 24% this quarter, so I'm counting on that .
I'm sure they'll say something positive in the news, because why wouldn't they say something negative? But I think Meta is a good buy because it's trading at 21 times earnings right now. It has double-digit earnings growth ahead of it. And that earnings growth, in my opinion, is more reliable than the earnings growth of other AI companies.
What do you think about that? AMD? Um, I think you can probably back AMD. You know, but the point is in the nuances. You can't say about the AI deal. Okay. So, if we hear a good report from Meta tonight, you know what the deal is? With AMD. Okay. 5.5% of their revenue comes from Meta. They're the ones that power the AI agents with their processors.
So you have to guess, right? What's the valuation? Who else is there if it's only 5%? Who else is there? Sorry, you have to look at the valuation. You have to figure out who the other 95% is, because maybe Meta is the one that's doing well . What happens, right? What happens if, for example, if Anthropic and Open AI, what happens if, after their report, we actually see the spending slowdown that we've started to see, and what if that has an impact?
There are a lot of what-ifs. So, you know, it's all theoretical, and that's why we're at this point. It's complicated, and that's why the valuations are a little bit depressed compared to what they were before because of skepticism. Look. Well, what we're saying is that the market is concerned and nervous.
We're saying, " What are they saying? You have no idea." you have." And it's normal for the market to behave like that. You know, Joe wants to buy some. Okay. I hope it works out. But don't assume that anything is going to move forward dramatically in the near term. Real money, real debate. Lots of talk.
Probably. Smart, Meta. Let's go. So you never know. In the past, the driving force was not profit , not revenue, but their capital expenditure budget. And I expect them to increase their capital expenditure budget. I expect the information on how the business is doing to be very, very good. And Meta is a perfect example of what I think a correction is.
The stock was trading over 800. I had a primary position. I added to it, doubled the position at 550, and then sold it. Now that's a real correction. Right? Because the stock didn't do, you know , it did something, but not as big as others. So Meta is one of those companies that which I will continue to trade, trading around the excess position, leaving the core position alone.
And I think, going back to your point, they're showing that AI can increase their revenue, can increase their cash flow. Why is there such an interest in trading around the existing position, instead of just maintaining it? If you believe in the company so much, and you've only said good things about Zuckerberg as a founder, who is still there, why are you trading around it?
I said, I'm not trading around the core position. The core position is the position you trade, it's the thing you don't touch, right? I understand, but you're still trading. Then what's the other position? The other position is... The market provides opportunities, and when you have the S&P virtually flat, and I admit that I like to make money, and I'm one of those investors who looks at absolute returns, not relative returns, and I don't get excited if the market is down 10 and I'm only down 5.
That's not my approach. So if I see an opportunity in a company that I know exceptionally well, like Meta, and I understand it very well , then I'm willing to trade to take advantage of it. It's a gift. Right. And that's where we're different. Carrie and I just hold it. And that's where we're different.
Carrie and I just hold it. Right? We just hold it. What do you think of Alphabet, since Mizuho said today that they're favoring it in the short term? It's one of their favorite internet companies for the near term. Truist shares are down to 420 on this pre- earnings basis. Everyone owns it, Joe. What do you think?
It's a bit of a weak link compared to the rest of the... The Magnificent Seven . I think that over the long term , for the period that Jenny holds the shares, Alphabet is a very strong investment due to the diversification of the model, as well as the ability to justify the cost if you look at the performance of the Google Cloud business.
Gemini 3— It's a fantastic product. It's very competitive compared to what we see from Claude at Anthropologie. I just think the stock has been slowly underperforming the market for most of this year because it was relatively outperforming the market for the previous 9-12 months . I think the catch-up phase is coming in 2027.
Okay. Let's look at Netflix. The stock is at its lowest level since August 2024 and has n't moved much in the last 5 years since earnings. The guidance was weak, the lowest revenue growth in the last 3 years. That's why the stock looks like this, but if you look at the big picture, the stock has looked like this for most of this period.
At least 6, 8, 9 months at this point. Can we please have the full- year numbers? There you go . That tells the story, right? Julia Boorstin will go into more detail on what's going on, Julia? Well, Scott, this is the sixth straight quarter that Netflix stock has fallen on earnings, with The stock has fallen 47% over the past year.
Today's drop came on a weaker-than- expected fourth- quarter revenue outlook, and Netflix also lowered its full-year ad revenue expectations to $2.7 billion from its previous forecast of $3 billion. Co- CEO Ted Sarandos addressed audience engagement issues on a call yesterday , saying they are focused on their core business: original films and series, licensed content, and live streaming.
He said experiments in the YouTube space are relatively small, and they are optimistic about the impact of new chief content officer Peter Rice. But Wells Fargo gave the stock an "underperform" rating, raising concerns, writing, " We believe that if engagement doesn't improve, then..." Eventually, members will spend less time on the site, log in less often , and then cancel their subscriptions altogether.
"Let's go ahead and say we can't help but think CCOO is changing the indicator state of the market, Scott. Yeah, Julia, thanks for that perspective. That's our Julia Boorstin. I don't know. The stock's down. Yeah, oh yeah, but the valuation is 18 or 19. So, all you people who like low valuations, go buy.
Good luck. Well, where are they? Here's what's going on. It's not cheap. It's not cheap enough? Not for Netflix? Right. Not for that revenue stream. That was the major revenue growth story. in online distribution. Great point. Only growth story. You can't compare. You can't compare historical valuation without comparing historical growth.
And they won't grow. They'll go the other direction. 100%. Right. That's why I sold them in the '80s. And I think all the streaming services, including Disney, I think you should avoid all of them. I think they have serious content and cost challenges ahead. As someone who's followed the entertainment industry for many years, I would say it has become a broadcaster .
It's not broadcasting in in the traditional sense, but that's what it does. And they need a lot of viewers. They need subscriber growth. They have virtually no advertising. They're having a tough time right now because they've got such a huge market share. Well, I mean, they have advertising. Yeah, I get it.
But that's not where they're going to make a lot of money. Yeah, they're not developing that segment enough. And they're in a very difficult position because their costs are going up. It's becoming increasingly difficult for them to produce their own product. They're not paying enough to the people who say they're the best, that they should be paying them for content.
Their model is even more dependent on content. Sure. Okay. We'll take a break and see if this market can remain profitable over that entire time. Nasdaq is currently outperforming by 1 and 1/4%. Of course, we'll see how it plays out. Mr. Weiss. FTAI Aviation. Macquarie released their data today, sending the stock higher.
They're forecasting a doubling in a year. That's pretty impressive. I agree it's going to go up significantly . Okay. I sold Fortress at 50, so it just using this to make me jealous. Albertsons, yield 5.1%, very cheap, some good things happening that could boost growth a little bit . Okay, there you go.
NextEra, it's a great utility company. And if there's a change in the House , bring back the word resilience, that will help NextEra. Joe T. What we were missing in Q3 was active trading volumes. You'll see that come back in Q4. That brings us to Interactive Brokers. Great news. See you at 3:00 PM. Okay , thank you very much.
Welcome to Closing Bell. I'm Scott Wapner, live. From the ninth post here at the New York Stock Exchange. This crucial hour begins with the first of the big tech earnings reports as Meta prepares to release its results. And in addition to that, Tesla will be in the spotlight too. Here's a look at the major companies.
We're all in the positive today. The Nasdaq is leading the way. Many tech companies AI is growing. Most semiconductor companies, including Nvidia , are also growing. Industrial companies are also showing good growth. Another good result is the financial sector. This industry seems to have come back to life.
We will be following this and everything else until the very end. But we will start by discussing the current situation. And now to our panel. Stephanie Link from Hightower, Requisite Spring Talking 10, Dan Ives from Yorkville Ives, Stephanie Brenner, both experts at CNBC. Welcome everyone. Dan Ives, I turn to you first .
And let's start with Meta. I think Julia hit the nail on the head . It's important, right? This range of capital expenditures. Is that a priority for you ? No doubt, but I think the difference in monetization, thanks to Muse, it's really starting. If you go back to the last few quarters, the whole problem was they were just spending money like 80s rock stars.
You weren't seeing real results. Now you are. And I think from an investor's perspective, It's going to be a strong quarter in terms of advertising growth. They could increase capital expenditures, but I think investors are comfortable with that right now given our faith in Muse. We could talk about some pieces that could ultimately add a hundred and fifty dollars a share to this story as it unfolds.
That's the difference this quarter has made compared to the last few quarters. Steph, Muse is the reason the stock had its best month since 2022, right ? It's up 27%, but there's competition coming. No, no. Some of it is already here, and more is coming from Frontier Labs, and it seems like almost everything else is .
So how do we handle that? I think the difference is that it's the installed base , and as Steph was saying, I'm talking about three and a half billion when you look at what they need to reach, that's their gold installed base . It's very similar to what Apple is doing, and to some extent, if you go back to Dario's letter and his essay, that was the best, that has ever happened to Meta and Zuckerberg, because this gives them an opportunity.
They're going to close the gap even more. They're going to hit the gas, and it's an inflection point for Meta right now . Monetizing that installed base . Now show that after the last few quarters spent in the penalty area. Are you expecting to get 27 figures on capex? Steph said, "I don't know if we'll get that." Do you think we will?
I think they could maybe talk about it in general terms. I don't think they'll give exact numbers, but maybe they want to kind of tidy things up to make sure there are n't any surprises in next year's quarter. Are you okay with not getting specifics for 2027? I think the market would be okay with it if there was at least some sense of where capex is heading, but it all comes down to whether you show monetization, like you do with Microsoft and the big companies.
Investors really want to see that, because , as I said, Musk, we need to double down on monetization. Steph Harris, let's talk about Tesla, okay? We'll switch gears. Brent, I'll get back to you in a second. As Phil said, all roads lead to a partnership with SpaceX. Is that all you're concerned about today?
Well, I think it's fundamental in terms of what they're showing, not just Optimus, but in terms of providing some onboard time. You could think about Cybertruck cabins and eventually robotaxis to show what level of urban congestion they're going to provide in the coming quarters. But this is all based on what Musk was talking about last night, and we...
We used to say there was an 80% chance these two would end up getting married, and now it's 90%. But it all comes down to what price are they willing to pay? I still think 500-550% is a price that would likely satisfy investors, but they have to show results within the Optimus project, the development plan.
autonomous driving , the artificial intelligence ecosystem. That's why SpaceX will eventually want to merge with Tesla. It's the leading mega-cap company this month. Its shares are up almost 9%. How do you respond to that ? Oh, I think we hit the nail on the head , because yes, SpaceX is ultimately buying Tesla.
And if you think about what's been happening with the stock, it's essentially transitioning from being an electric vehicle player to being an artificial intelligence player. And there's been frustration during that transition, and you've seen it in the stock. But now, finally, some of the things that investors want to see as part of Project Optimus, as part of the autonomous driving roadmap, are starting to emerge .
The map, around the Cybertruck cabin. And then it all comes down to, like, the five in front of the stock—that's what will ultimately lead to the SpaceX deal? Aren't you throwing your hands up and publishing notes about Musk's return to politics and other things because you weren't happy with the way things have been unfolding?
around the last election? You've said so, you've written about it, you've said that he should return to being CEO of these companies. Well, he's fully engaged in the race for the Texas Senate, and of course, the Wall Street Journal is reporting that he ordered a slowdown of Starlink because of Ukraine.
Why aren't you complaining about any of that? Yeah, that's a great question. I mean, for me back then, it was really important, as opposed to today, where as CEO, you keep him informed of what's going on at SpaceX and Tesla. I think the big issue back then was what he was doing in government, and you felt like I wasn't on top of things.
The political situation... Look , it's... It's a balancing act here. Because it's a balancing act. Because there's a certain reason when you talk about Starlink and everything we're seeing in Texas. And, of course, how Tesla and SpaceX are doubling down on their investment in development. It's a balancing act for Musk.
Because you have so many good things going on. in terms of SpaceX and the AI ecosystem. But the more you get involved in political theater, the greater the danger. There are negative consequences. You call it balancing. He does n't seem to see it as such. He seems to be just going to do what he wants with his money .
The richest man in the world. And if people don't like it , that's your problem . Don't buy stocks. Do not buy the product. Yes. And I think a lot of it comes down to the fact that when you think about some resistance to Starlink, you're going to need support. You... I'm starting to notice it. In terms of the consumer market, as we saw with Tesla, I think Europe is a good example .
A huge, apparently anti- Musk, anti-Tesla reaction. But now we see a rebound. The reason is that he eventually began to emerge from the political theater he was talking about. And look, it's Musk. He goes his own way. But now it will be a balancing act, as he is in a strong position with SpaceX and Tesla.
Fine. Thank you for being here. Hi all. Welcome to Blue Cloud Trading. This is the second segment of the video where we look at a number of stocks that were discussed in the Halftime Report and Closing Bell. And today, Wednesday, October 21, 17:44. So, Tesla and Meta's profit results have been released.
Meta is currently rising after the close of trading, while Tesla is falling. We'll look at this in more detail in a few seconds. Markets: The S&P 500 Index rose 0.58%. The Nasdaq rose 1.05%. The Dow Jones rose 0.69%, while the Russell 2000 rose 0.25%. In this video, I'll cover about 11 of the ETFs you see here, including gold, silver, EuroStoxx , Bitcoin, Ethereum, oil, S&P 500, QQQ, Dow Jones, Russell 2000, and VIX.
We'll then look at about 22 stocks and ETFs that were also discussed in today's episode. So, let's start with the heat map. This is what it looked like. It's equal weight, okay? You can see that technology stocks have done quite well today. The same can be said about industrial stocks. The situation in the health sector was mixed.
Diagnostic research companies generally performed well, as did some biotech companies such as Vertex. Several utility companies also posted strong results today. The financial sector has recovered somewhat. Let's look at the market by size. You can see what it looks like at the end of the day based on the size of a Fortune 500 company.
Okay? And then if we look at what happens after the close of trading, that's also important. So let's take a look at the dynamics after the close of trading. And you'll notice that Meta is up 3.3% in after-hours trading, while Tesla is down 1.7%. Let's take a look at what was said about Meta's profits.
Meta beat Q3 revenue expectations and announced a two-for-one stock split. So it opened the big tech earnings season after the close on Wednesday, beating revenue expectations, but GAAP earnings per share were hurt by legal costs related to the teen mental health settlement. A two-for- one stock split was also announced, resulting in each owner of Meta's Class A shares receiving a non- voting Class C share.
This essentially allows Mark Zuckerberg to retain overall control of the company while allowing it to continue funding AI development. Then Tesla reports, and as you can see here, it beat expectations with positive free cash flow. As a result, the company exceeded third-quarter earnings expectations, generated positive free cash flow and delivered better-than-expected capital expenditures.
It says here: " Third- quarter earnings were better than expected, and free cash flow and capital expenditures exceeded Wall Street forecasts." It says here: " Tesla shares rose in over-the-counter trading, but as you can see right now, they are down 1.73%. " So it jumped up a little bit and then started to come down, okay?
Let's take a look. If I enter Tesla here, you can also see the chart in Finviz Elite. Guys, if you like this software platform that I use, it's called Finviz Elite. The link is in the description or in the links section of my YouTube channel. So here's what it looks like now. I'll zoom in a little .
Shares on the secondary market fell by 1.9%. Let's switch to the 3-minute chart. And you can see how it went up just after 4:00 PM. It rose a little and then began to decline. It is below the cloud on the 3-minute chart. Fine. And I also want to start the analysis, technical analysis of SPY . Let's start with this." The S&P 500 index showed a good result today.
It rose by 0.52% and made a very positive move if we talk about the Ichimoku indicator that I use. It broke through the nine-period green line you see again. This nine-period green line is called Tenkansen. This is the middle of the last nine periods. And it's applied right here. And when the price goes above that line, and the green line is above the 26-period line, the middle of the last 26 periods, and the price is above the Ichimoku cloud itself, and the Chikou Span, the current price that is projected 26 periods back, that white line, if that white line is above the candle from 26 periods back, that's also a very bullish signal.
So, today the S&P 500 finally received a blue flag. As I mentioned in previous days, we have broken the nine-period line for almost five days in a row and now we can expect a potential rally tomorrow. Fine? Because the S&P 500 will be watched and we'll see if the price can move above today's high of 774.44.
If that happens, there is a better chance of at least a return to the 782 level, which is about 1% lower . As for Oil K, and by the way, if we look at the weekly chart, folks, it's still very bullish here, although as I mentioned, the S&P 500 has been kind of stuck in this very tight consolidation range lately, right?
So week after week we stay in that small range, and we're still there. But this is a good sign. This is a good sign. We will accept it. Oil K, which is the ProShares K-1 Free Crude Oil Strategy ETF, is still The price has reached the 61.33 level and is forming a so- called doji on the weekly chart today.
Here is the daily chart. The price fell slightly by 0.43%. But we're still holding above the moving averages on the chart, above the moving averages on this daily and weekly chart. While this is going on, Oil K also gets a blue flag. As for the other ETFs , there are technical issues , so they are not as strong in terms of trend.
Let's look at QQQ, for example. Okay, let me remove this old trend line. We are currently below the nine-period mark on the weekly chart. Do you see? And we are at least forming a good bullish pattern. This is called bull harami. A large red candle followed by a small bullish candle. There is a high chance that we will see the price move higher next week, perhaps even this week.
We will reach a level above the nine-period curve. Here is the daily chart. We drop down , find support right at the top of the cloud, and bounce back . We bounced off him . So will it break through these, uh, trend lines? Sorry, these moving averages. That is the question. Uh, I wouldn't add it yet.
In my opinion, this ETF has yet to prove its worth . Okay, let's look at the next one, guys. This is DIA, this is the Dow Jones ETF. And on the daily chart we are still under the Ichimoku cloud, so it is bearish territory. We see a small upward move, but now we are at a resistance level. The cloud is a very strong resistance level.
Let's see what happens in the next few days. Now it has grown by 0.64%. Day. Here is the weekly chart. On the weekly chart it looks quite bullish. So, there is a fairly high probability that we will break through this cloud. This cloud is also very thin, so it is very easy to break through this level.
When the cloud is denser, it is more difficult to break through it. Let's look at the Russell 2000, which is still down and still in a descending channel. Okay, we don't want to add anything here. We are still under this cloud. No, on Russell on the daily chart. The VIX volatility index is inside the cloud, which means it's neutral again, okay?
So, uh, it entered the cloud again yesterday and then continued to fall. This will greatly contribute to the stock market starting to recover a little. So, you know, today was a good day, for sure. FEZ, Euro 50 shares also rebounded, rising 0.78%. However, the trend has not changed. Well, we're still in a downtrend, so I obviously wouldn't add this ETF to my portfolio.
And we are still under the cloud. GLD is still in a downward channel. So neither gold nor silver are still in a downward channel. No silver. Fine? It rose 0.34%, but that's not necessarily a change in direction. Not yet. We need more, as I said, evidence to confirm this. Bitcoin, as I mentioned in yesterday's video, we got a good buy signal on the daily chart.
The price moved back above the nine-period level and then bam, it gapped up, rising another 2.78%. But remember, Bitcoin only looks strong on this specific time frame. We don't have any weekly confirmation of this yet. We are still in neutral territory because we are inside the cloud. So, but we broke through and...It looks like we might even close above the 4668 level.
This is very positive. The next resistance level is likely to be around 10.5% from the cloud top. And if we can break through it, then we will have a nice strong uptrend again . But right now the weekly chart is neutral and the daily chart looks pretty good, okay? Ethereum is not like that. We have a fast moving average that is again 9 periods below 26.
And yes, we gapped up and the gain was 3.37%, but we have resistance right here. Fine? On the daily chart. So I would hold on. And on the weekly chart we are still below the cloud. So it's weaker, okay? Okay, let's continue. Now we'll look at 22 stocks and ETFs. I'll go through them now. Fast. Only three tickers at the top are marked with a blue flag, meaning that only they look bullish on both the weekly and daily charts.
For those of you who are swing traders, you understand why it is important for the higher time frame to confirm the shorter one, right? You will have a higher success rate in trades when you trade with the trend, okay? If you want to buy, it makes sense to buy stocks that are moving up, not down, friends, okay?
Not down, because a downtrend can last for a significant amount of time. And the good news is that uptrends can also last for a long, you know, long time. Right now we're still testing, okay , on the weekly chart, this weekly level is, uh , 344. What is that? 344.57. It's essentially going back to that high right here.
You can see the high right here on this candle. And the maximum of this candle was on Friday, July 31st. Fine? Think about it This is data for July. So we have not yet been able to successfully break through this level. I think we're almost there. Look at the daily chart, it's about to break through it.
Let's see what happens next. The next company is Moderna Inc. Let's start with the weekly chart. Very strong uptrend. This is what you need. You can see that since breaking the cloud in March 2026, the price has risen 368.4% since then. It was a good uptrend. On August 21st, the price also broke the 200-day high, and this was with a large candle on high volume.
Now it continues to move and will try to test some previous levels. This is likely the final high at 497.49. Well, that's still a long way off. We need another 50% to reach that level. level . But, uh, that's exactly where it's all heading . Uh, and on the daily chart there is also a very strong uptrend.
This company still has negative profit margins, negative sales growth, and negative operating cash flow of $1.1 billion. So the fundamentals here are not particularly good, but the demand for shares is very high. And XLE, let's look at this one. Let's start with the weekly chart. A very strong uptrend for the energy sector, apparently.
Right ? And here is the daily chart, also very bullish. Up 0.29% today. Uh, seems to have stalled a bit the last 3 days or so . Fine. Now, the rest of these guys don't have blue flags, which means there might be something technically wrong. I've already looked at them all , so I know something is wrong on one of the time frames, either the weekly or the daily.
In this case, it is a weekly chart. Price below Cloud is bearish territory. On the daily chart we are breaking through a higher level. Thus, we receive conflicting information. Fine? Personally, I would refrain from purchasing. It is a company from the grocery store sector, the consumer goods sector.
On the daily chart it looks strong, but again, there is no such support on the weekly chart yet. And then we have CRWV. We talked a little about Core Weave. Interestingly, it still finds support at this level that I drew on October 19th. It is based on this candle, the July 29 candle . So if we zoom in a little bit , you can see how the price has been stalled for several days, 5 days in a row, continuously closing above 60.55.
So there is support here, very strong support. Will it bounce back? I don't know, but I wouldn't add as long as the price stays below that cloud and below the 200- day moving average. As far as I understand, this is still bear territory. Concerned. We have a series of lower highs and lower lows and that's not good.
You can see how the price broke through these lows. But we can also potentially prepare for a double bottom pattern to form. Right? And so if we can break through some of those levels, that's probably the level I'd be watching. Then it will make more sense. But that's quite far. I would refrain from this for now.
FTAI is still in a downward channel. And, as I said, this can go on for a very long time. Price broke through these moving averages here. It was July 1st. And since then it has fallen by 37.7%. And so it's almost impossible to tell when a trend is going to change unless you have a chart, a technical indicator, you're using it, looking at the technicals.
And this, in my opinion, is the ideal indicator. Because when the price breaks through it, you can see it visually. Ichimoku means One glance is enough to quickly assess what is happening with the price. And when the price breaks through this cloud, usually positive things happen, but not always. It may be a short-term situation, like here.
Or a longer move, like here, where the price has risen by about 84% in just 2 months. Right? Here, where it broke through the cloud and, you know, grew by about 50% in 2.7 months. You will get a backlash when the price goes lower. This is why I do not recommend adding positions when the price is below the cloud.
Fine. I think this has already been established. I don't need to talk about it too much . GE Renewable is below the cloud. No, not about that. Google is also below the cloud. No, not yet regarding Google. Let's look at the weekly chart. The weekly chart is still above but below the moving averages. KLAC is still above the cloud but is pulling back.
On the weekly chart, uh , daily it's lower. So no. This is KLA Corporation. LRCX is below the cloud on the daily chart. No. Marvell is above the cloud. Okay, but the fast moving average is below the slow one, and the price is below them. So no. On the weekly chart we are holding at the 26th period level.
Bull harami. Next week, there's a higher chance we'll see Marvel continue to grow, and that's entirely possible. As you can see, the price finds some support from the cloud. But until that happens, I would refrain. MTUM has rolled back. It is under the cloud. It's inside the symmetrical triangle you see here.
I would refrain from investing in this momentum ETF. NEE, NextEra Energy. No thanks. It has been in decline since breaking below its moving averages on May 15. It fell by 16.4%. And it looks like it's likely to continue falling. We have a bearish engulfing pattern here. Like this. One positive thing: the green line crossed the red line.
This is good. But otherwise, things look pretty bad, and the weekly chart is also very bearish. You can see how the price moved up, found resistance right at the top of the cloud, and then pulled back and created a bearish harami pattern. Netflix is still in decline . It is currently under the cloud on the weekly chart.
On the daily chart it also rolled back. He created an inverted hammer. The inverted hammer is typically a bullish single candlestick pattern that appears after a pullback. And that's a perfect inverted hammer if I've ever seen one. Let me show you what it looks like. Go to my page X. There will be links there.
Scroll down a bit and click on this candlestick pattern reference sheet. Click on it. And you'll find all these different candlestick patterns, right? So, we will look at the bullish trend. And we'll be looking for a single candlestick pattern that looks like this. Here it is, the inverted hammer. The fall is visible.
And then a candle like this appears. Long wick on top. Okay, and then the body, right? This is what you have here. The opposite of this is a shooting star. Here, in a bearish trend. If you see the exact same candle, but it is at the top of a move after the price has already moved up, it is a bearish trend, especially when the price breaks below the low.
So if I didn't sell Netflix now based on just this candle, tomorrow. But if the price breaks below that low, that will cancel out the potential reversal, okay? Fine. Nvidia. We have a small spike above the cloud on the daily chart, up 2.5%. But it is still below the 9-period and 26- period moving averages, so I would refrain from buying Nvidia.
Let's look at this on a weekly chart. It is located between two moving averages. At the moment, there is a rather weak upward trend. RSP, the Invesco S&P 500 equal-weighted index, looks very bullish. This week, as you can see, we broke the 9- period interval on the weekly chart. So this is a very bullish signal for equal weighted stocks, guys.
On the daily chart we are right below the cloud. We have a positive crossover. However, the cloud remains bearish. Fine. But I certainly wouldn't go short on that index, okay? Fine. SMH, Semiconductor ETF. Remember that level, level 537.79, that I shared with you? The level that I indicated on October 16.
The price found support there, right? I found support here in this area and here. It is currently bouncing off this level but is under the cloud. So there is no support for SMH yet. But... There is upside potential this week if we see a recovery in semiconductor stocks , and also next week. SPCE ( Space Exploration Technologies, SpaceX) showed big growth today.
The price rose by 7.79%, but a reversal candle in the form of a spinning top formed. Little Red Wolf, no this time . Fast moving averages are below slow ones. So while it looks quite attractive due to the percentage jump, the type of candle that follows it as it was formed today was quite bearish. If we switch to a three- or five-minute chart, we can see all this movement.
So let me show you what I'm talking about. Okay, so we see the situation hour by hour, right? You can see what happened. Basically , the price opened with a gap up to this level this morning . She rose a little more. And then what happened? The price started to fall around 10:00 am. See it here? Around 10:00 a.m.
she started to fall. She came back. Height. Around 12:00 we had a lower high than we had at 10:00. The price then remained mostly in a sideways range for some time. At about 1:30 pm the price dropped a little more. Okay, so now we're inside the cloud. So, even though it's up 7.79% overall, I see some profit taking happening after that .
So yes. Now let's look at Tesla. Oh. I'll switch to the weekly chart first. Here is the weekly chart. This is a closing place. Now remember, Tesla released its earnings report, right? So let's see what it looks like after the market closes. See how she fell a little ? Did you notice this? Let me show you again.
Here's what the weekly chart looks like. What the weekly chart looked like at 4:00 PM. The growth was 3.41%. And then, after the market closed, bam, the price dropped. As you can see, all this happens after the exchange closes. Let's look at the daily chart. A " shooting star" figure is formed there.
The price reached the level of 395, and then sellers began to put pressure on the price down. So I wouldn't be too enthusiastic about Tesla tomorrow. Now let's look at the 5- minute chart, which will show you all the events that have happened since 4:00 PM. We see a small, quick, spike right after the earnings announcement because it looked pretty optimistic, the information and the news looked pretty positive, but after Wall Street digested that information, they decided to sell, and the sell-off in Tesla shares began.
And she's still falling. On the 5- minute chart it is below 200. Good. Let's continue. This is what it looked like at 4:00 PM. Fine. VRT Veritiv shares jumped a bit by 4.29%, but as you can see, a gap formed up, so what happened next? A red candle has formed. This was the opening price and the closing price, meaning that a sell-off immediately began as soon as the price approached the resistance level in the nine- period area.
So, Veritiv is not showing positive dynamics. If you look at the weekly chart, it is also neutral now. It is located inside the cloud. XLF looks very good on the weekly chart. Financial indicators are starting to look very interesting again. I think we've already mentioned this in the program. Yes, we've seen a little bit of upward movement in the last three weeks, okay?
And this week, if we can close above nine periods, because we still have a few days left before the close before Friday. We have Thursday and Friday. We need confirmation on the weekly chart. Here is the daily chart. It's still bear territory now. We're still under the cloud, and there's a good chance we could also...
Once we reach that level, we'll go up another 1.2% or so, and then pull back. So be careful. Be careful with XLF. I wouldn't get too excited just yet because we don't have confirmation, okay? What we have , well, is a lower minimum. Fine? So, we see how we rose step by step. And then we broke through about this level, and the price fell.
Boom. Now we're moving up. We do n't have a higher maximum yet. We will literally have to overcome this maximum. So let me fix this level. Let's set the maximum at 5860, literally. 58.6. Here. This is the daily level. So this is a historical maximum. We are still much below him. Yeah, we're at about $56, that's 5860.
Okay, guys , let's take a look at this. As you can see, we are still under the cloud, below the moving averages on the daily chart, and on the weekly chart we are at least finding some support. The price just keeps moving along this cloud. It's clear? She is moving . She is not included in it. She doesn't bounce yet.
It's just moving sideways in the industrial sector. What I mean is that it is a relatively bullish signal when price at least holds above this cloud. There's a higher chance that we'll see a sharp increase , but until that happens, I would, you know, wait. Looking at the daily chart, we are still in decline.
No thanks, we are not investing in the industrial sector yet. But remember that there may be individual stocks that are very strong. There may be certain industries that are very strong in each sector. That's exactly what I do on weekends: conduct a much more thorough analysis of sectors, industries, and the most promising stocks within those industries.
And I share this with our participants. So if you guys are interested, please consider becoming a member. Access last week's video. I'll show you what it looks like. So when you land on my page, Blue Collar Trading, this is what the thumbnails for the members only videos look like. I release one of these videos every weekend.
Usually this video is about an hour long, okay? 54, 55, 54, 59 minutes, hour. It's just me. And I look at a lot of charts. As I said, I also share my portfolio in each of these videos. So, you'll be able to better understand why I participate because I go into more detail about my reasons for participating, what I'm getting into, and what I share with Legend level members since there are different levels of membership.
Click Join and you will see Blue Collar Supporter and Blue Collar Trader. At this level you will be able to watch these videos. At the Blue Collar Legend level, you'll not only be able to watch these videos, but you'll also receive daily stock and ETF trading updates that I publish. You will find them once you become a Legend level member.
Here, next to the publications, a new tab will appear and you will see “Membership”. Fine? Click on it and you will have access to it . Fine. And if you want to check out some other links on my page, right here at the top, click on the 10 extra links, and don't forget to hit the subscribe button, guys.
If you haven't subscribed yet, the latest video we just posted has been viewed by over 40,000 people. For some reason, and I can't figure out why , I only have 33,600 subscribers, which leads me to believe that thousands of you have n't subscribed yet. I do n't understand. This doesn't make any sense to me.
It only takes 5 seconds, click the subscribe button. Subscription is free. If you click the notification bell and like these videos, you will receive updates. You will be able to find my videos when you receive a notification at the top, this will make it easier for you to find them. And this is very relevant information, right?
Every day I post these videos. So, consider subscribing for free, consider getting access to the videos by becoming a member. Click on 10 more links right here. Scroll down and you can get a $25 coupon for the charting software I use, TC2000. See the link to Finviz Elite. Possibly Starlink. Starlink Mini.
Get $100 credit after using for 2 months. You might live... I have a lot of viewers in Canada. I think internet access is very limited in many places in Canada, especially in the outback. And here's the Starlink Mini —it's a fantastic product that will allow you to access the internet no matter where you are in the countryside.
Some of you may live in Maine. For example , I often go hiking. I have one of these Starlink Minis and I use it a lot . This is the only reason I use this link at all. This is a referral link. Let's see what else. And check out other links if you want. Guys, thanks for watching. See you in the next video. Ichimoku Guiding Star. A blue cloud stretching through the night.




Comments 0