
저자: 미상 · 외국인
요약 보기
미국 증시 주간 점검: 금요일 대형주 하락·중소형·동일가중 상승으로 로테이션 진행. S&P500 5300 하방 목표, 나스닥100 조정 구간 분할매수 전략 제시. 실적 시즌 순이익률·서프라이즈 강세, 소비자 연체율 상승 및 고용 둔화 등 매크로 경계 언급. 연준 금리 인하 기대 변화와 FOMC 주목.
다듬은 글
so today I was scrolling my YouTube comments for yesterday's video thanks for watching by the way and it became abundantly clear to me that a huge portion of you guys bought the Russell 2000 right here sold the NASDAQ 100 right here and you were now left holding the bag so today's video is for those of you holding the bag those of you whose wife won't divorce you because it simply isn't worth the effort or time my goal by the end of this video is to make you so much money that your wife is going to who want to divorce you so let's make some money this week in like this video apart from semiconductors a very actually Green Day across the board software 2 did take it on the chin but I would call it more of a flat showing more than anything really growth in these big names got sold off and then we really did just continue the rotation we've seen over the last couple of weeks I mean financials were very very positive this is on the back of PayPal's earnings that help Credit Services real estate energy Industrials they were all in the green today we did see a bit of downbeat action we did see Consumer Staples take it on the chin after PG's earnings report today that didn't help the defensive trade along with just everything else rallying today but the big boys really did weigh on the overall Market stuff like Nvidia Microsoft Amazon Tesla Eli Lily and that's why the market cap weight S&P 500 was down the equal weight actually gained today it was a huge Divergence between what the equal weight did and the and the S&P 500 market cap weight did and that was mostly on the back of technology and discretionary being in the red specifically technology down 2.6% led by semiconductors but we're going to see what this is going to look like tomorrow AMD actually raised its guidance for the third quarter year in 2024 that's definitely going to have an upbeat effect on semiconductors and we're going to see how that's going to affect technology the discretionary space Staples down 6.7% and then materials down.
3% as well the best performing sector was energy followed by financials real estate utilities communication Services Industrials and Healthcare so the broader economy really seeing byy side action across all sectors and size as well small gained midcaps gained it was really just core and growth in the large side that didn't gain in fact value in the large sector was one of the best performing factors here today it beat small growth small core midcap growth midcap core so certainly a value rotation occurring under the hood and as long as we continue to see this type of price action against this you know that rotation trade that we are seeing in the market I think we're going to see this type of price action all the way through August September and maybe even through a little bit of October October is when we can really start to see the growth trade pick up again in into the end of the year now the S&P 500 was down.
5% the NASDAQ 100 was down 1.3% the iwm was up. 38% it actually outperformed both the S&P 500 and the NASDAQ 100 the RSP equal weight was probably the biggest winner here today very crazy price action very close to all-time highs as well it gained 48% and then the Dow Jones roughly gained the same it had a very very good day and it's very clear to see that large size were sold in favor of pretty much everything else now what helped small cap performance today was yields yields fell 79% as a result bonds gained and commodities gained too gold was up 1.15% also on the back of bar potentially adding more to his gold position as well as silver up 1.98% crew did fall all in all the big story when it came to the technical aspect of the market today definitely was the equal weight in fact this chart looks very very constructive the equal weight is about what maybe .
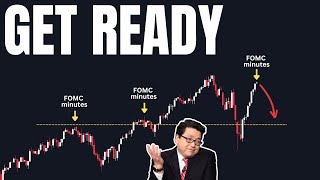
7.8% away from New all-time highs this is a new alltime high and above right here that's a new all-time closing high so 173 just below the 173 Mark is where the RSP makes new alltime high is looking very constructive this is very constructive price action from these lows bottomed out right here and moved up and I think that's what the RSP and the iwm and small caps as a whole are doing we can see that SP 600 sort of like had a bit of a digestion period right here back to 52 we Highs at this level right here very very very constructive a little less constructive in the iwm it just hasn't taken this level right here but the iwm is actually small cap micro caps the sp600 is pretty much more of a small cap index unlike the Russell which has a ton of these like small cap micro cap companies the sp600 is pretty much profitable small caps you can definitely see that it's moving in the right direction and that's why I say you know don't go out and buy the Russell 2000 we use it as our Benchmark but you want to look at something like the sp600 maybe the half index another ticker is X shq small cap quality ETF that's where you really want your money in the small cap space not necessarily uh the iwm but that's what we're seeing right now in the iwm we are seeing both digestion of these gains but also a bit of a rally back to highs again we broke the 52e high in the S sp600 we'll see if we can get new all-time highs here in the equal weight and that's probably possible if we get some of the macro data some of the earnings data and the fomc goes our way we can definitely see a push here up to alltime Highs at that point probably means more upside there is nothing more bullish than new all-time highs now let's talk about the S&P 600 now not much moved in the gamma tape pretty much everything stayed where it is but we do have the co resistance still at the 5300 and that means below this right here below the gamma flip we are selling weakness to the 5300 area this is a line where we'll bounce and find support now we can definitely find support and bounce off before the 5300 area with the probability ility is very likely that we're going to go to or around this 5300 area in negative gamma dealers like to take the price there to hedge their books that's why these levels are so key and Below negative gamma if we go ahead especially break that level let's say tomorrow we break this low that we made earlier that definitely opens up the 5300 area now I think 5300 is going to be a fairly strong support because we almost used it as resistance right here we used it as a support and resistance zone right here you see resistance turn to support then came down bounced off it a little bit and then continued to move higher and then if we actually take a measured move from sort of like this green line to new alltime High that was a very solid 7% move with that so it is a very key level if we do pull down pull back to this 5300 I expect us to find strong support right here and then continue the move to the upside especially if Market breath continues to do what it's doing we can see the advanced decline line almost at a new all-time high as the S&P 500 has come lower that's simply because under Neath it all under the hood stocks are moving higher we can definitely see this with stuff like the RSP pretty much at new alltime highs the S&P 500 quite a bit off its all-time highs if we actually take a measured move you see the S&P 500 4% from its highs the NASDAQ 100 sitting at about correction territory just nearing the correction territory Zone here at 10% I think it's a great time to start nibbling on something like the NASDAQ 100 I think a 10% pullback you know if you load up right here you're getting a very good index I do think it's going back to alltime highs by the end of the year and generally speaking my plan of attack every time indices or stocks that I like pull back about 10% right that's where I load up quite a bit so I load up every 5% I'll add a little bit and then every 10% is where I do a big buy and then at 15% 20% on the way down that way you add at the key levels when the market pulls back and we generally see markets normally tend to Pivot around you know 5% 10% uh 15% 20% if you actually go look at where um tech stocks pivoted in 20 21 it was about a 21% pullback um that's where they pivoted and went higher from there so you know these 5 10 15 20 levels tend to be good psychological levels but when it comes to the S&P 500 for this week things are looking a little bit Grim I still think 5300 is our downside Target as long as we're below 5525 as long as we're below this zone right here 5300 is our ultimate Target into um August Opex and then we can actually uh Bounce from here if this does move lower to the 5200 area that's where things get Grim because then we're actually looking at maybe making a lower low not just on the daily chart but this is a key level right here on the weekly chart as well but above the 5525 we're buying dips selling rips to the 5750 area and guys earnings is looking very very good the fundamental picture actually hasn't really changed all of these companies are reporting great earnings and I think if the macro holds up along with rate Cuts stocks look fairly valued if not cheap in certain sectors at these levels after a mere 5% pullback right now now looking at Market sentiment this is CNN's fear and greed index and sitting at the neutral zone guys last week this indicator finished at the neutral zone and in that week we actually saw it go from about here into greed back into the neutral zone and this is where we're sitting right now at the 47 level kind of crazy volatile price action it mostly has to do with the large cap selling off small cap selling up but Market breath overall improving that's why we're actually seeing this indicator stay in the neutral it does place a bigger weight on Market breath as well as credit Market technicals and that's why it's probably not moving in the same direction like some of the other sentiment indicators nonetheless according to the sentiment is at neutral and we can actually see more upside and the truth of the matter is the oex ratio is signaling to us that it is time to start getting into some of the names you like especially some of the bigger names this is the ox open interest ratio essentially trct the S&P 100 so the biggest 100 stocks in the US market and generally when the oex X ratio gets to this point right here when the oex ratio does like Troth this often is a very good signal of institutional buying and it's a great signal to get long and stay long in the big names and I think one of the big reasons why institutions are loading up under the surface has to do with earning some of these bigger names stuff like apple Nvidia Microsoft have actually had a significant pullback some incorrection territory into this week's earnings where 34% of S&P 500 companies are reporting then next week 9% and the week after that 3% but we have a significant amount of S&P 500 companies reporting and normally when you have stocks coming down into earnings and they beat they tend to overshoot to the upside actually stocks falling into earnings is a rather good setup to generate Alpha and earnings are coming in a lot better than expected in fact we got yesterday's new numers and nothing much has changed we actually saw earning still around 12% and revenue at 4.8% this is the analyst estimates at the start of earning season but the biggest change right now is actually net margins net profit margins at the start of earning season the estimate was 11.8% right now with 210 companies having reported 12.1% net margin growth guys this is huge that is very very bullish and I I think it's part of the reason why we're seeing this buying under the hood institutions know earnings is coming in good margins coming in better than expected and when earnings are growing margins are expanding that's a great environment for equities also something else 78.6% of the 210 companies that have reported have actually reported above analyst expectations this compares to the long-term average of 66% and something else to note if you actually exclude energy S&P 500 earnings is sitting at 133% right now so right now earnings looking very very good and so far we've had the highest Alpha for Beats since the fourth quarter of 2018 when companies beat on both sales and EPS the stocks rallying upward of 3% one day after this compares to the long-term average of about 2% and slightly above the average right here for companies that are selling down when they miss on both sales and EPS so despite where valuations are right now what the S&P 500 has done this year and the extremely high expectations on earnings if you beat on both you're getting outsized returns and if you miss on both the selloff is not as bad as it is in comparison to history it's a great setup and something that not a lot of people are talking about now we had quite the day of earnings before the open we had Sofi PayPal fisa BP PG crazy Merk as well after the close we had AMD Microsoft Starbucks Pinterest and we're going to kick things off with PayPal now PayPal had a double beat guys all of this is recorded pre-market except earnings that happened after the close now PayPal had a double beat they reported EPS of $19 against $11 38% beat I believe on adjusted EPS 19% on gap on revenues of 7.89 billion the stock was up 7% here in the pre-market the CEO left some comments given the strength of our business they raised the 24 guidance increased share repurchases 2024 guidance was something like $5 billion in free cash flow they guide for free cash flow they moved it up to 6 billion that's a big beat and then they increased their share repurchases from 5 billion to $6 billion as well really good earnings across the board I'm going to do a further Deep dive in a members video so I'm not going to go deep into PayPal but great earnings and a basic discounted free cash flow shows the stock like 56% under Fair Value fair value at 134 and that's just using the trailing 12 month free cash flows multiplied by 7% growth rate cash total debt shares outstanding that's the figure you get so a lot of room to run in the stock we'll see if this is the Catalyst that can take it to the $70 region and above looking at a couple of the other big names that reported AMD their earnings came in line however they raised next quarter's guidance and that's why they were actually upbeat here in the after hours Microsoft reported a double beat but the stock was down 7% I didn't dive into why probably has to do with the guidance issue Maybe one of those segments didn't perform as well but the market not really liking their earnings Starbucks earnings came in line ver solar earnings came in line it was a very very mixed day across the board but we're going to see how the Market's going to move tomorrow with better than expected guidance for AMD and Microsoft being down so are we going to put more weight on semiconductors infrastructure or software Tech or is just all of Tech going to get sold as a result but very mixed earnings here today so on this channel we look at a lot of macro and today we're going to look at some macro indicators that are a little bit scary to me because we have to look at both sides of the aisle this right here is 60-day loan delinquency rate Prime and subprime auto loans and we can actually see that we are ticking levels not seen since 2016 here in Prime autos and when it comes to subprime auto loans we're looking at levels above is concerning you don't want to see delinquencies tick up in the way they have at the same time credit card delinquencies are also ticking up to near post GFC levels and the is telling us that the consumer is softening under the hood despite the growth numbers and employment numbers we're getting in the market as of late on the topic of employment payroll growth excluding government Healthcare and education has actually Fallen below the zero line this right here is often a strong indicator of an incoming recession and we have to see where this tails off to a lot of this that we saw we thought was normalization but when normalization keeps dipping it becomes a problem and once payroll breath Falls below 60% of Industries Equity performance tends to suffer as you can see right here here and here and you can see some pretty crazy Max draw Downs if you look at this table right here however we are not there just yet we are just above the 60% line and that's why this week's NFP numbers are absolutely key we get NFP on Friday and the expectation is for 225,000 that's both his estimate consensus 175,000 something else that's going to bring volatility this week is the fomc rate decision and I just want to bring out a chart right here and this is essentially how I see fomc last time we saw the market fall into fomc was in May and there seems to be a noticeable difference in the current setup compared to then the selloff in equities in May was almost perfectly correlated to rate cut expectations dying as fed fund features drop and priced out Cuts equities rebounded with the return of rate cut expectations over the next few months as you can see right here this time things are different equities have sold off but rate cut expectations have actually risen very interesting so realistically there's actually no dobish fuel left in the tank for equities into this fomc outside of just cutting rats this leads me to believe that if we see equities continue to leg higher the driver isn't the FED anymore it's something else a lot of this rally has predicated on right Cuts if equity keep going higher from here then it's more than just easy and monetary policy driving fund flows like this video and leave a comment for the algorithm cheers




Comments 0