저자: Chase · 외국인
요약 보기
S&P500 8일 연속 상승 후 에너지 약세로 횡보 조정(소화 구간)이라고 진단. 방어주 쏠림은 Jackson Hole 전 헤지로 해석하며 5500 이상 눌림매수·5700 목표 제시. 8월은 변동성 큰 시즌이고 9월 전후 조정 가능성, 기업 실적은 예상 상회, 경기 서프라이즈 지수 회복으로 펀더멘털은 양호하다는 입장. 은·금 강세도 언급.
다듬은 글
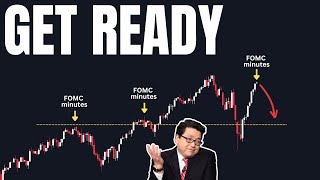
Hello friends Bulls Bears degenerates policy makers and ladies it's that time of the week again where the stock market does absolutely nothing and somehow I end up making 20 minutes of pure gold so on today's episode I think that the data dependence of the markets and the FED is very tough for investors and I'd say we always know the summer is tough August historically is a tough month for markets and like this video we officially broke the 8 day winning streak in a row on the back of energy being a complete dumpster fire this sector was down like 2 and 1/2% but there was a lot of red there was a lot of green the S&P 500 and NASDAQ were pretty much flat here today and to me when you look at this price action I'm just see a lot of price digestion digesting the gains over the last 8 days and getting ready for what's to come in the next couple of days we have the fomc minutes Jackson Hole pmis as well as housing data and the Market's just getting ready for that in the context of having rallied 8% or so in the last week but there were a couple of bright spots we saw Healthcare led by Eli Lily outperform as well as consumer defensives which is a bit concerning cuz these are defens sectors but we also saw outperformance relatively in stuff like Microsoft and this infrastructure space led by pandw they were up 7% on their earnings yesterday then we saw Apple Google they were in the green especially up 3.57 when the entire Market is down that's relative strength we saw PayPal right here up 3.9% visa and MasterCard really did help the financial sector do what it did today the best performing sector was consuming Staples up half a per followed by Healthcare and real estate so you can definitely see defensive sectors leading and it's is smart money probably just hedging ahead of the Jackson Hole speech there was news going around that the FED are potentially considering cutting rates either 25 or 50 basis points at Jackson Hole that would be an indication to the market that something is not right under the hood it's never a good look when the FED does an emergency cut and that's part of the reason why we saw our performance in Staples Healthcare and real estate also going into September it tends to be quite a volatile month of the year and smart money big money need to be positioned ahead of time moving down though energy was the worst performing sector falling 2.6% but there was a lot of geopolitical concerns and international news driving that we saw technology down 4% materials down 4% financials down 4% so heavily cyclical sectors in the red defensives in the green but I don't think it's actually anything to get concerned about in my opinion I just feel like a lot of the these sector discretionary com Services utilities the price action just looked like a lot of digestion especially in these large cap names where it really got ugly was small caps Smalls value core and growth you know they were down significantly this actually looked like riskof behavior in the small cap space and that is never a good look everything else was relatively tame in the midcap sector as well as large caps we actually saw large cap growth was actually up.
2% today so if you were in stuff like the mega cap names Tesla Google Amazon your portfolio probably was green and globally we also had a very mixed day China was very red Asia was actually very green India was green so was southeast Asia Malaysia Taiwan Japan was green same too with Australia Europe was actually fairly red Europe tends to track the us more than it does Asia then we saw North America Canada the us fairly red and then South America black to Green so a very mixed day globally but when the US market is red you're really going to see flows to the downside because the US really lead flows and especially when you have the us as a red day Euro has a red day China has a red day Global Market at least let's say you're in a global ETF something like the awci right if you're in something like that you definitely had a pretty ugly day today but all in all I really see this price action particularly here in US Stocks I just see this as very very healthy price action being completely honest we're just digesting gains after 8 days of green in a row and some very strong price action that's simply all we're doing yes we are seeing a little bit of a defensive rotation ahead of what can be a volatile week with the pmis the fomc minutes and Jackson Hall but one day's worth of price action isn't enough to discern anything we can really start to get worried if we see continued selling in cyclicals and a continued bid in defensives until then buy dips because buying on dips has simply work this here had you bought at the start of the year and then bought this dip right here bought this dip right here bought this dip right here you'd be up a lot on your positions we saw the S&P 500 again just digesting all of the gains we've had in the last couple of trading sessions if we actually zoom in we did see some very interesting stuff with the gamma situation now the gamma flip did move up to 5550 very interesting the cold resistance actually moved down from 5750 to 5700 the put support actually moved up to 5400 so what we're seeing is just a little bit of volatility compression that tends to happen leading up into key events and then volatility expands the S&P 500 is a stone throw away from alltime highs and it's really going to be dependent on what's going to happen with the pmis and Jackson Hall I don't think the fomc mines is going to be anything significant Thursday Friday is when things are really going to get moving for the market so right now anything above 5550 you want to buy dips sell those rips to the 5700 area however there is a bit of risk because let's say we do get some bad pmis and then we just Gap to like this 5500 area and then start selling we would then be negative gamma and we would then look to the 5400 area as our next Target so with the gamma flip moving up you put support mve moving up and the core resistance moving down that is a bit of negative sentiment under the hood especially in the options Market however until we actually break the 5500 area and probably have a close below you still want to be buyers of dips sellers of rips because the market actually looked pretty good today I mean excluding the iwm that was down 1.17% everything else looked fairly healthy the equal weight the RSP was only down 4% the NASDAQ 100 was only down 24% and the S&P 500 down 2% virtually a flat day all things considered smaller size did get hammered midcaps were down nearly a% the S&P 600 down 1.19% and we did see a volatility impulse here in the vix up 8.25% but again after the rally we've had in the last 8 days you could even say 2 weeks that is to be expected we saw an interesting dynamic in yields we saw a very similar Dynamic to what we saw yesterday the 2-year yield yield fell 1.6% the 10-year yield fell 2.4% and the dollar also fell half a percentage point and then looking at the commodity space gold was up 38% notching another all-time closing high at the 2530 area silver at 2942 staying above this $28 area in hindsight this is a great place to enter silver putting in a higher low relative to this low right here and retaking some of these highs the next Target ultimately would be like the 3150 level and then the 52 we high level for silver silver looking constructive gold looking constructive and Equity is also looking constructive the S&P 500 this looks really good I mean in hindsight we should probably have more of these digestion days on the way up but we're having one right here the NASDAQ 100 also looks really really strong the S&P 500 looks stronger the NASDAQ has rallied more this year iwm I mean the chart doesn't look that great you don't want to see this type of candle right here but it's what you pay when you get into the I M the RSP I believe actually notched a closing High yesterday couldn't do the same yesterday that's an all-time closing high for the S&P 500 not quite the wick Highs but definitely closing High very strong day of trade the broader Market is showing relative strength along with the mega caps as well and that's really what you want to see Market breath still looks very very strong still near all-time highs for the advanced decline line a very positive Divergence there for the S&P 500 and then if we actually look at the RSI still room to run the S&P 500 not quite overbought if we actually pull up something like the NASDAQ very similar situation as well as the iwm and RSP and this is telling us again a lot of the price action we saw you know is just today was just a bit of digestion of these games everything did rally I mean even if you pull up the iwm measure it on a peak to tro basis right that's still a 10% move in the iwm there's a lot of alpha right there sometimes you do have to take some profits take some money off the table especially going into risk events like Jackson Hole later this week but for the remainder of the week nothing has really changed in the S&P 500s we want to be buyers of dips above the 5500 sellers of rips and our Target is 5700 we're in positive gamma right now and we don't want to fight the trend the trend is strong so buy dips sell rips until we actually break the 5500 area and guys looking at sentiment this is CNN fear and greed index and what a turn of events I mean if you actually look at the history right here one week ago we were just in extreme fear one month ago we were in fear and then a year ago we were in the fear territory as well but this doesn't tell the entire story you know just 11 trading sessions or 12 trading sessions ago we were right here in the greed section we then moved all the way to the extreme fear section and now we're actually just in the fear Zone closer to the neutral zone than we actually are to the extreme fear Zone absolutely crazy and the market has literally gone from Goldilocks to recession to soft Landing we pretty much went from all-time highs made a correction and now we're back to near all-time highs it has been quite a volatile market and to be honest you should expect this type of volatility this time of the year you can see that around this mid July August area in the election season we actually normally pull back and then we par a lot of the gains we made up until September and then sort of at the start of September actually pull back all the way up until November and then we go on the end of year run and that's actually what we're doing right now just with a lot more volatility and outsized moves due to the beta of the market at the moment you can see that from mid July into August we've pulled back we've had a bit of a rally and if we actually then sort of trade sideways and down into the September October area that would be well within history and in fact if we actually look at something like the returns after a 7-Day win streak in the S&P 500 you could see in 7 days we returned 6.82% s winning days in the S&P 500 this was over the last eight trading sessions the average return 1 week later is half a perc but the average return 1 month later is 96% and while this is very positive you do have to put it in context to what we just had in a single week and this just means after we've had this we can actually trade sideways so over the next 6 weeks still expect quite a bit of volatility and that's why smart money is positioned the way they are you you can see that smart money went into bonds cash in the month of August that's what they rotated into and they rotated out of equities Japan Euro zone so anything tied to the Yen carry trade anything tied to technology anything tied to Banks discretionary anything cyclical big money moved out of that and they actually went into bonds Into Cash real safe havens real defensive part of the market and that's because big money smart money institutional money is not paid to beat the S&P 500 they're not paid to generate you Alpha in excess of the S&P 500 they're paid to manage risk and they do that by being in the right places at the right times and that's why we see the rotation we're seeing in fund manager positioning this is FMS investor positioning so it's prudent to say that they do expect quite a bit of volatility over the coming weeks seasonality tells us that the price action we're seeing tells us that we can actually see sideways momentum in the S&P 500 and that would just be this over the next couple couple of months that would actually be historically normal however through all of this we do have to look at the fundamental picture and S&P 500 earnings is reporting above expectations 4.5% above expectations actually and earnings revisions have been well above the median I showed you guys this yesterday but we didn't dive into specifics and for the third quarter of 2024 the biggest revisions we're seeing right now is energy Industrials Healthcare they were all revised down 6.6 by 5.1% and 4% respectively utilities and information technology were the best performing with upper Provisions in utilities and slight down revisions in technology the S&P 500 right here actually got revised down 1.8% kind of beish but to be expected in fact I think third quarter as well as fourth quarter EPS estimates should continue to come down I think we're going to see a lot more down revisions in infotech as well as com Services I think this number here should be closer to 3 to 4% in that range for the S&P 500 and that would mean the third quarter earnings which is now positioned at about 8% should come in at about 7.5% if we get that that would be healthy and still growth quarter over quarter year over-year nonetheless let's dive into the macro looking at the US economic surprise index as well as the survey surprise index very interesting to see surveys and cycle indicators have actually started a recovery and this is what we mean by that so survey surprises have actually been on the up and up while economic surprises have not normally the surveys actually lead the economic surprises as you can see right here we get a pushup in surveys economic data trades flat and then it follows suit to the up and up and this is actually a huge Tailwind meaning that we should actually see better data in the coming weeks in the coming months into the end of the year that should be a Tailwind for the economy and by extension for equities heading into rate Cuts potentially in September at the same time we did see CEO conference have a huge rebound throughout 2022 23 and in 2024 however we did see a slight decline right here last month this is the conference board CEO conference consumer confidence continues to remain robust so what we're seeing is CEOs feeling slightly less positive about the economy consumers feeling slightly more positive about the economy net net we' call it even and that's why we actually saw us recession probability tick down from 25% here to 20% in the long run recession probability is about 15% that's generally what it always is but to see here at 20% we did see actually a tick down that was actually in the context last week of weaker than expected building permits and industrial production numbers but we do think that the weather had a big role to play with that hurricane Barrel really did affect a lot of jobs in the south of America and we need to keep looking at the data to see how we respond to that Goldman don't see anything too big and that's why the recession probabilities went from 25% to 20% in the last week something else that's been completely swept under the rug is the amount of sneaky m&a we're seeing going down under the hood 7eleven was targeted by Circle K to buy a bunch of their Japanese Holdings we saw AMD offer $5 billion to buy ZT systems we also saw Mars to acquire Kell NOA in a $30 billion deal this is really conducive to a rate cutting cycle when the FED Cuts rates when when money becomes easier we tend to see more m&a look at what we did from about 2013 all the way to 2020 when rates were pretty much at zero we saw huge up Market move in m&a we then got rate hikes we saw this plummet and we are actually going to see a recovery the average m&a deal size to be bigger in 2024 than what it was in 2023 and by 2025 26 we should see deal sizes and number of transactions in excess of what they were in 2022 and hopefully we can go take out the highs we saw in 2021 this is really good for the entire Market small mids and large caps but it's particularly good for small caps now guys the big week of data starts tomorrow tomorrow we have the fomc minutes all eyes are going to be on that what the FED has to say especially when it pertains to a September rate cut then on Thursday we have initial jobless claims and the pmis the expectation there is 235,000 for jobless claims PMI at 48.5 US service pmis at 54 and then on that same day existing home sales at 3.9 million I think this is going to be a big one to watch especially because building permits housing starts were a complete dumpster fire last Friday and then we have Jerome Pals Jackson whole speech on Friday along with new home sales I don't know why they released these two economic indicators on different days really should do it at the same time or the same day but they do and new home sales expectations is 600,000 and then guys looking at earnings we had Low's report today actually terrible earnings in my opinion but the market it seemed like it was priced in they missed on Revenue missed on EPS Revenue declined 4.4% earnings EPS declined 18% something like that it was ridiculous it was crazy bad but um it was already priced in and that's why the stock was only down like 1 1 and a half% today but tomorrow we have Target Snowflake and zoom so a fairly big day here for software particularly these like smaller cap software names and these Niche software names like Snowflake and then Target is going to give us another parameter for what the consumer is looking like along with stuff like ma Macy's and TJX so a pretty big day uh tomorrow for earnings for the consumer like this video and leave a comment for the algorithm cheers





Comments 0