
원문 보기
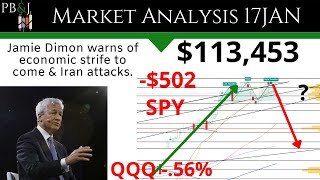
Hello everyone, SPY jumped 1.8% like a rocket today , rallied with a gap up, breaking the trend structure on heavy volume . It's not clear what's behind the markets moving so strongly past previous levels, but everything is very bullish and continues to be so. However, let's take a look at the charts on all sides.
Do me a small favor , like the video and subscribe , watch the video until the end to support the channel, and let's get started. Coming to the news today, Michael Burry has stepped in again and said that we are close to a major peak, close to the conditions of 1987. I would argue that it was probably closer to 2001.
I still believe this is a very high level , not just in terms of the S &P price , but also in terms of many other indices, which are higher than we have ever seen . You can see that everything is in profit today. Michael Burry is talking about a big short position again , which is understandable. I think this is a kind of bias on his part , because he has made a lot of money this way and is expecting the same success again .
As mentioned, this could just be an internal bias , but there are also some things we need to note. The SPX and M2 money supply ratios hit all-time highs in 2001 , and we are now back at those levels . And Michael Burry also says that shorting is not for everyone. I can do short, but most people shouldn't .
Again, this indicates his bias. As for the Fear and Greed Index , it has gone from 42 to 46 . As we have seen, everything is touching the sky. However, strength is not recovering much. The breath is moving slightly with it. I would like to see how the short-term breadth indicators are doing . The put-call ratio is decreasing very rapidly.
And volatility has also increased a bit today . Interesting . Increasing volatility is generally not a good thing when stocks are rising. The increase in demand for safe havens can be interpreted as an indicator of greed . And demand for junk bonds is falling. This is showing extreme greed in terms of that indicator.
Overall, very interesting . But the biggest thing that really surprised me was the breath. Let's see how it goes, as the strength continues to weaken . Looking at the economic calendar , everything is almost negative except for factory orders, which were revised up slightly . The markets didn't care , and as for tomorrow , there's only a little soft data as we await the jobs report on Friday .
We'll see how it goes, but until then there's no significant data to report. Looking at the charts, we can see that prices have been rising throughout the day. It was very strong in the pre-market and continued somewhat during the session, but it was mostly in the pre- market, so it was a bit difficult for me to trade.
I didn't do anything during the session because I didn't really believe in such an aggressive move through these levels . Maybe the next zone you should look at is near 786, those numbers seem crazy to even think about. It seems like it was around 350 just a few days ago, but I've been watching the markets for a while now .
If we look at the SPY charts here , we can see how much we have expanded. The upper ATR band is near 763 here and we have risen to 772. So, as expected, it expanded massively . The 4-hour chart has expanded significantly . Let's see, daily chart. It has risen to that upper ATR band , which is where you know you can expect resistance.
We'll see if this happens now, but in any case, today's rise has taken us past the previous high , leading to bullish conditions here. So, now I have turned bullish again, and even if prices decline, we will look for a bullish move again after the pullback. Looking at the Nasdaq, the same bullish story is playing out here, with the price going all the way to this downtrend line that we're observing.
Now, this is a clear resistance zone. Will we go beyond it and go up? There is 726.85 for tomorrow, looks like it will go down a bit from there . Maybe AMD is influencing this a little bit , but in terms of short-term statistics it's spread out too much . If there is a rejection here , we would expect the price to move back towards the 703 zone.
Moving on to the Q's charts on the Tasty charts, you can see bullish conditions emerging again. It's not as widespread as spy charts . It will be up to the 747 area , but we remain bullish. The second ATR band 731 is interesting for our chart . Sure, I know we've spread ourselves too thin. We have entered bullish conditions here.
We talked about this yesterday and discussed how we are shifting to bullish conditions . I didn't expect a move like this, but it's very powerful . Looking at the hourly chart again, it is very overbought . I expect some pullback from that resistance zone , but the bullish conditions mean we will look for some support.
Looking at Russell and Dow, it's the same story there. Both Russell and Dow are extremely powerful. Russell has reached an all-time high here again . It remains to be seen whether we will move beyond this level. The same is true for super powerful candles and the Dow, respectively . There was a breakout above this area here , crossing with a gap.
There are large gaps left, and actually a lot of gaps at the back too , which will be replaced . The question is, when will that be? They will never be empty. Is it time for the bubble to burst, as Michael Burry said ? There 's definitely a possibility, but everything looks very bullish at the moment .
There's nothing to say about Dow right now. As for Russell , this area is worth watching, maybe up to 313 could be interesting, but the overall market remains bullish. When it comes to SPX and M2 , as I said at the beginning and in the article , some things are looking very bearish . Here is a rising wedge pattern , which is a major trend formation.
We touched on it right here. Being above this all- time high , it is now an all-time high according to this metric. This looks like a massive rising wedge that could eventually break down bearishly and drop to much lower levels, but for now we should wait for a breakout. There is still a chance that the price could rise further, which could break this formation , but I will keep an eye on this.
This is the main chart I follow. When it comes to Apple and Microsoft , Apple is up a bit, making up some of the losses it lost over the past two days , and Microsoft is bullish . It's dropping a little bit in after hours , but I expect it to hit 506 before it drops hard . Momentum RSI is very bullish, but has risen a lot, so keep that in mind , but the 507 target area.
When it comes to Tesla and Nvidia , Tesla is up 1.64%. Does it change in a V-shape? I think this is very interesting . Momentum is bullish, RSI is turning bullish, everything looks good there. Let's see if it continues to rise, Nvidia has come close to the neckline again. Oh, it's crossing that area in after hours, so Nvidia could be very strong early tomorrow .
If it breaks out here, it could go to the all-time high of 3230 . That would be a move of about 15 points , something to watch out for in Nvidia. As for staples and discretionary staples, they rose marginally, finding support after the market closed and rebounding . Discretionary stocks rose slightly after the market closed, but remained roughly steady throughout the day, still struggling in resistance territory.
It seems very strong to see, but this is just a return to old levels, perhaps a chance of rejection again, let's see. We are still above that level at the moment . Looking at the 20- and 50-day breadths , both have improved strongly, confirming today's rally . There is support here, the 20- day moving average also found support, which means everything is going bullish with the rally, so there could be more upside .
There are still concerns about the Nasdaq , but the S &P looks strong. As for the dollar, it is holding a support level despite a slight decline , which I hope will remain a bottom pattern and rise again . After the dollar strengthened once again. This could add pressure to equities, but for now we remain in this region .
Momentum is still slightly bullish . So, again, I hope it picks up . Let's look at bonds. Bonds actually gained some momentum here . Bonds are moving up past the resistance area here . TLT also rose with a gap above this level . Yields are clearly decreasing somewhat. Interesting . Momentum is shifting to the bullish side.
The RSI is also turning bullish. Everything looks a bit bullish and confirming that rally . This is still a downtrend formation, but it could be the start of something. Let 's look at Vix. Vicks has received some support. Both the Vicks and stocks rose in the same day. Again, this is usually not a good thing.
And that's what we see today. So, let's keep an eye on this . This was supported in the same area we talked about earlier . Again, this is probably indicating a turning point . When it comes to my accounts, you can see that I haven't made any transactions today. There is no movement . No trades were made.
The market was very bullish overnight . I couldn't really do anything with it. Everything was fine during the session, maybe there was some more trading on the Nasdaq . Russell also showed some movement during the day, but I wasn't so confident . We have already expanded a lot in many metrics. I noticed that some indicators were not moving with the price.
I don't know. Let's keep an eye on this for tomorrow. I have decided to stay away from trading today . Let us know your thoughts on Michael Burry's comments in the comments section . Are we reaching a peak , or will it continue to grow like this forever ? Let me know what you think. Huge profits for many years in a row.
Can we continue like this ? Let me know. Otherwise, like and subscribe . If you learned anything from this video, press the bell icon so you don't miss future videos. Certainly, none of this is financial advice. This is all just for fun . Good luck with your trading, and may you have a good day today .




Comments 0