
원문 보기
Okay, so today the market is up again. We see another incredibly nice bullish reaction. The spy is flying. QQQ is flying. They are both renewing their all-time highs today. So, this market is just unstoppable. There's not even a single top signal right now suggesting a possible pullback or a possible correction ahead.
So, let's see what's going on, what to expect next. I mean, what if we see a correction? What if we see the market collapsing? How to proceed? Well, that's what we're going to try to figure out in this video. Welcome to the Financial Hydra channel. My name is Nathan. In this channel, we always talk about technical analysis, trading psychology, trading strategies, etc.
Every single idea is based on technical evidence, not on personal opinions, not on guesswork, assumptions, or good feelings. We always work with technique. So, we can design practical strategies together. [snorts] Welcome to another daily update. So, we see the spy going up today making another very nice bullish candle renewing the all-time high.
If we take a closer look at the one-hour chart, recently we saw a pullback. We briefly lost this moving average as a support level. However, we reacted very quickly closing above this key point in in this in this very same day and then we kept going up. Now, if you ask me, this sequence of higher highs, higher lows is still totally intact.
Therefore, the uptrend is totally valid on the one-hour chart. Meaning, guys, this means that a pullback on the daily chart, it is going to be very difficult to happen unless we see a technical reversal on the short term, on the one-hour chart, losing the 21-hour EMA, making lower highs, lower lows.
the spy is not going to make a pullback. What's more, we are just making another bullish candle today. If you ask me, "Nathan, what if we see the spy going down tomorrow, losing today's low, making another bearish candle, losing the 21 hour EMA, making a lower high, lower low?" Then okay, then I see a pullback ahead.
But in the absence of such technical evidence, no, the spy is supposed to continue bullish. The bull trend is supposed to persist because us Dow theory tenant tenant number five says, "Trends persist until a crystal clear reversal occurs." Do we see a crystal clear reversal right now? No. So, this trend is supposed to persist.
Very simple situation, not rocket science at all. If we see top signal, okay, then we can change our ideas, we can change our strategies in the Guys, in the blink of an eye, okay? We do that very quickly, but uh for now, there's no technical evidence supporting a pullback. We see the QQQ also going up nicely.
In this case, this reaction was a little bit more treacherous because yesterday we closed below the previous candle's low, making a bearish reaction. That was a technical top signal on the daily chart. Then you take a look at the one hour chart. What is missing over here is a lower high, lower low. Okay?
Yes, we briefly lost the moving average, but in the end, we still closed above it on the one hour chart and on the daily chart as well. So, we by failing to make a lower high, lower low, the QQQ rejected the idea of a top signal on the daily chart. And right now today we see another insanely powerful candle.
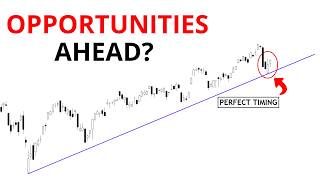
So, the idea is still the very same. If tomorrow we see another bearish candle losing today's low, losing the previous support level, making this a true double top chart pattern, all right, then I see a technical reversal short-term wise, meaning a pullback medium-term wise. Any pullback on the daily chart to this 21 day EMA, to the 664, or maybe even to the 644 down here, could be just another harmless pullback without ruining the previous uptrend.
I mean, I don't know if if we can consider this rally an uptrend because we lack clear higher highs, higher lows, right? It seems we are just exploding since March 30th. We are just exploding over here. So, I'm still not so sure about the idea of a bull trend, a healthy bull trend, but if we see another pullback, maybe that could be another buy opportunity.
And that's where I see good opportunities to buy, guys, near support levels. The spy could collapse all the way down to the 724, to the 715 area, near the 21 day EMA, and the trend would still be bullish. And then, we would try we would focus on buy stocks near the support level because we always like to buy near support level.
We don't buy far from support levels. We don't buy near resistance levels. We buy near support levels because the risk-reward ratio is better near support levels. So, it is in the end, it is all about risk-reward relationship. If it is good, we can trade it. If it is not good, we don't trade it. Very simple situation, right?
So, for now, since we are far from our support levels, I don't see the spy or the QQQ offering any clear amazing buying signal right now. No. And and again, guys, I'm not saying that we should short. Okay, that's not what I'm saying, because shorting a rally is crazy. Rarely this works very well, okay?
So, I prefer to stay on the sidelines, especially on high beta stocks, tech stocks, and then I wait for a systemic correction. After a pullback occurs, all right, we'll see which stocks are looking the best, and then we can trade them. But for now, I don't see the spike, QQ, and many other stocks offering us any good clear signal, if you ask me, according to my humble trading philosophy.
Now, for instance, guys, we have Nvidia. This one will report earnings in 7 days. It is exploding. It is making a new record high again. For swing trading purposes, we can't trade Nvidia that close to earnings report, okay? It is too close, only 1 week away from earnings, so that's not tradable for swing trading.
If you are a long-term investor like myself, okay, you are very happy, you are making a lot of money, so you are safe. There is no clear technical major reversal long-term wise suggesting that Nvidia will ruin the bullish case for it in the long term. So, so far, so good. We see a new record high. There is no top signal.
Nathan, what could suggest a possible top on Nvidia? Again, if we see lower highs, lower lows, losing the 21-hour EMA, making a bearish candle on the daily chart, losing the previous candle's low, that would be a classic checklist of a technical short-term reversal and medium-term pullback, which is more suitable for swing trading, okay?
But again, [snorts] only after earnings, we're going to have a better clue of how to proceed, because for now, we should just wait on the sidelines. For instance, guys, if we see Nvidia collapsing after earnings, collapsing back to this 21-day EMA, back to the 200s again, right? Okay, maybe we can buy Nvidia again.
For swing trading purposes, I love taking advantage of these distortions after earnings. Usually they Usually they are the best, okay? But uh for now, we have to wait. So, patience is the key, all right? Meanwhile, we have many many other stocks performing very well. We have Tesla, for instance, exploding again, right?
It is Once again, it is exploding. Yesterday, we saw a possible top signal. And guys, that's a very good example on how we like to proceed, okay? Yesterday, we saw a top signal, all right? And yesterday, I could not record our video, all right? Not even on on Monday. On Monday, I did our weekly live stream on our Telegram channel, but I could not record our video here on our YouTube, okay?
Because I was on a small trip, all right? If you follow me on Instagram, which by the way, it's right here. I forgot. Right here. At The Finance Hydro, take a look. Uh if you follow me on Instagram, you can have access to my uh insights, other insights, and to my personal life here in Brazil. What What I do, what I'm doing, etc.
So, follow me over there if you want to keep in touch. If you want to have uh more ideas about trading psychology, about trading strategies, etc. So, for more content, follow me at The Finance Hydro on Instagram. All right. So, uh yesterday, we saw a bearish candle. Okay, that's quite spooky, right?
However, guys, there is no reason to worry because remember, only one single bearish candle is never enough to make a full complete bearish case. If we saw the lows of this candle's low today, and if we saw Tesla making a lower high, lower low, losing the 21-hour EMA, which by the way, is acting as a phenomenal support level recently, that [snorts] would be a reversal.
Okay, that would be a technical signal reinforcing the idea of another pullback, but so far, so good. Tesla maintains the bull trend totally intact. I gave you guys a call to buy Tesla on our Telegram channel down here, okay? Our target was near the 416, but if you are still in Tesla, that's amazing, okay?
The trailing stop again is below today's low. So, if we see Tesla losing today's low in the next few days uh tomorrow, then okay, you can sell for profit-taking purposes, but not for shorting. That's our philosophy. That's how our strategy works. Recently, we nailed many good bottoms in Tesla. We bought here, we sold here, we bought here to sell here, and maybe you're still holding, all right?
So, that's amazing. That's simply amazing. If you want to join us over there, the link to my website is in this video's description. I offer a a service called the 5% project. There, I share my signals, strategies in real time, first hand with you guys. There's no excuse. You will learn how to trade professionally using a clear strategy for every single trade on our Telegram channel.
I explain in detail why we are buying, where to sell, where to place the stop loss, etc. How to work strategically, not emotionally. So, join us over there. Weekly live streams every single Monday. See you there, my friend. The link is in this video's description, okay? I'm sure you're going to like what we have to offer, all right?
So, Tesla looks very nice. No top signal yet. What's more, we have AMD. Lady Amy, right? You guys say that I say AMD, okay? I don't know why. To me, I say AMD normally, but uh No. Uh okay, that's not important. We see AMD st- stabilizing near its all-time high area. [snorts] Ah, Nathan, that's dangerous, right?
Not necessarily. Not necessarily. We saw a similar stabilization over here, and then we kept going up, okay? So, that's not So, guys, we can't rely too much on that. On what we can actually rely, take a look on the 1-hour chart. Do we see a lower high, lower low? No. But, we don't see higher high, higher higher low yet.
So, what's the key point now? The key point is 426.10. If we see Lady Amy losing this key point, making a bearish pivot point, losing this support level chart, okay? Confirming the idea of an evening star candle formation on the daily chart, see? This three candle formation has a name. It is an evening star.
I teach you guys how to trade many candle formations, chart formations on our technical analysis masterclass. I teach you guys how to do this properly using risk management, using strategy, etc. for free in this channel, for free. It's here on this channel right for you. Just take a look over there.
Technical analysis masterclass. Um just search for it. The Finance Hydra masterclass, okay? You will find my video teaching you the the the basics, the core of technical analysis in a way that you will never see on YouTube. You will never saw a video like this on our YouTube channel. I swear to you guys.
So, just take a look over there, okay? Technical analysis masterclass. So, the key inflection point 426.10. Remember this key point. If we close below tomorrow, making a bearish pivot point on the 1-hour chart, that's your lead to I mean I mean [clears throat] guys, I'm not an advisor, okay? I'm not saying that you should sell AMD.
No, no, but that's going to be an alarming signal suggesting a pullback ahead. And I'm not saying that AMD is going to reverse because it is far from that. All that I know is that even if we see pullback, maybe to this 21-day MA to close the gap at 3:59. Any bullish reaction near the support level could be another buy signal.
Okay, so to me AMD looks phenomenal. All right, I'm eager to buy this one again. I gave two calls on our Telegram channel to buy here near the support level. We did a phenomenal trade. We sold it already, right? But uh now a pullback would be very good because we may buy AMD again, especially now that it that it already reported earnings.
So, I'm just waiting for another correction to buy more. And that's going to give more fuel to the uptrend, okay? Pullbacks are good. That's what most people fail to understand. Most retail traders fail to understand. Bull trends are made of higher highs, higher lows. We We have to see lows. But as long as these lows are still above our support levels, as long as we still see the uptrend intact, any pullback is just another buying opportunity.
That's why we see trends made of higher highs, higher lows because we see pullbacks, people buy. This gives more fuel to the stock, and then it loses momentum, approaches our support level, people buy again, right? That's a healthy movement. For now, if you ask me, this movement is not necessarily healthy because it feels like it is too vertical to me.
We deserve a pullback, but who knows, right? We'll see. Only time will tell. Now, we have Palantir collapsing 4% today. Guys, I was eager to buy Palantir again, right? But uh it is not making any clear reaction yet. It is just collapsing. It is making another bearish candle. On the bright side, we are approaching our very same old support level between the 1.8, 1.25, this key point over here.
We [snorts] bought Palantir multiple times in the past near this very same support level. We bought here. We bought here. Now, maybe we're going to buy here again if we see the right reaction. So, I am very excited about this movement. Okay, that's what I tried to tell you guys. When we see the spy flying like this, no, it's it's not a buy.
When we see any video going up, no, no, it's not interesting. AMD far from support levels, no, no, that's not good yet. Palantir looks good. Not because it is making a bottom signal right now, because there is any, but because we see a good stock near a classic support level that we bought multiple times in the past, okay?
We we we made we made many trades near this very same support level together, right? So, we are approaching a very emblematic key point, which I like a lot. I'm watching it very closely, and I know that any bottom signal here could present another buying opportunity. Because even if we are wrong, we're going to lose a little.
If we are right, we can nail another phenomenal rally like we did in the past. That's the core of trading. You got to learn how to mitigate your losses and maximize your profits on every single trade we take, okay? That's how we do That's how professionals do. And remember, if you are still enjoying this video, subscribe this channel.
Subscribe the Finance Hydra channel, because we are here every single day identifying the most important inflection points together on every single one of our stocks. We are here talking about technique, strategy, and trading psychology every single day, right? So, I'm sure you're going to find valuable information in this channel.
So, subscribe and click on the like button to support me as well. All right. Now, okay? Is there any bottom signal? No, no, no, it's not a buy yet, but maybe it will. Okay, maybe it will very soon. And then we have Robinhood. You know, this one looks relatively promising to me. Okay, relatively promising because we still lack some technical evidence to support my bullish case.
I like Robin Hood a lot. I mean, not as a company because as a company I hate Robin Hood. I'm I'm not going to repeat myself over here. I hate this company. It is the most diabolical company ever to me. But, but it offers amazing good opportunities for swing trading purposes. Recently, we bought Robin Hood here.
I gave you guys the call here. After closing this gap, we made a bullish engulfing. I teach you guys how to trade a bullish engulfing here on this channel, on our masterclass. And then our target was this gap. Okay? We closed It is funny because we closed this gap with an astonishing precision. And right now we are collapsing again.
So, okay. Robin Hood Robin Hood made a very nice movement. We did a phenomenal trade. Now, what's next? Well, to me, if Robin Hood makes a new higher high, higher low, breaking the 80.82, our next technical target will be 93.32. That's where I see Robin Hood next. If we see the breakout of the 80.82, I'm not saying that I'm I'm going to buy Robin Hood again because we already sold, all right?
Our target was here. Okay, so we sold Robin Hood. Amazing. We bought here, then we sold here. Phenomenal trade. Now, if we break the 80.82, that could trigger another meaningful bullish reversal, a higher high, higher low. And after that, our next target will be the $93. And then [snorts] we'll see how to proceed.
Okay? For now, there is no clear breakout as far as I know. If Robin Hood continues to correct, we may retest the $71 again. All right? So, we got to be extra careful regarding this movement. But for now, guys, only a breakout of this resist of this resistance level could bring something new. So, let's watch 80.82 very closely from now on.
Remember, if you want to trade with me, join our Telegram channel. The link to my website is in this video description. And guys, soon, very soon, new mentorship program. If you want to talk to me, if you want to my individual help with your investments, teaching you how to how to actually manage your positions, that's your opportunity.
New mentoring program very soon, so keep in touch. Stay safe, guys. See you tomorrow as usual. Bye-bye.



Comments 0