
저자: Nathan · 외국인
요약 보기
S&P500(SPY)과 나스닥(QQQ)이 사상 최고가 근접 및 지지선 위 반등으로 상승 추세 확인, 돌파 가능성 제기. 엔비디아는 트레일링 스톱 매도 후에도 141.5 갭 목표로 상승 여력 주장. 테슬라는 326 지지에서 반등 중이나 추세 전환(고점·저점 상승) 전까지 조심 필요. AMD는 저점 하락 구조로 약세, 팔란티어는 상승 중이나 PER은 성장주에 무의미하다고 주장. 애플은 247 목표 제시. 기술적 분석만 근거로 하며 영상 말미에 유료 커뮤니티(5% 프로젝트) 홍보.
다듬은 글
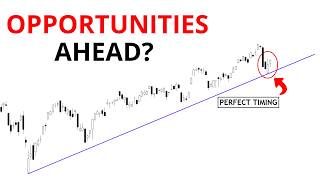
once again we see another insane bullish reaction as we see both the spy and the CQ Rising almost making new alltime highs today and of course reacting very well just above very important support levels now this not only confirms our previous idea that yes the trend is clearly upwards but also increases the chances of a true breakout of their resistance levels which could indicate that yes we will see a new alltime high next in the absence of technical evidence to the contrary because this is all about this Channel all right here in this channel we only talk about technical evidence no emotions no guess workor no gut feelings no stress here we only focus on technical analysis to design our strategies strategies that will guide us in this Market you are welcome to study now as we can see here yes spy is insanely bullish we are on the verge of breaking the alltime high at 610 now this entire area is a very dangerous resistance level if you ask me Nathan is there any chance that spy could make a top signal from here yes in fact now would be the perfect time to do so but right now we do not see any any top signal there is not a single bearish reaction suggesting that spy is going to trigger a pullback or reverse this bullish sentiment recently we just collapsed over here to retest the 21 Day ma the $600 area which was our major inflection point over here right and right now we are reacting very well this is very good because well according to our trading methodology we should buy every single time we see a pullback to our support levels when we see stocks dropping We Don't Panic All right we don't panic you don't panic you use the Panic of other people in your favor and then you can buy using strategy using a good risk reward ratio because that's all about trading okay we got to use a good risk reward ratio in in our favor and when the risk Rod ratio is very good is precisely when we are near support levels so by near support levels sell near resistance levels I'm not saying that spy is a sell or a buy right now because not investment device but right now all that I know is that spy is on the verge of breaking this resistance level there is not a single top signal yet spy is looking very good if we see if we see a top signal and again we can't predict prict the future if we see a top signal okay maybe you're going to see another pullback another pullback may bring new opportunities to us we'll see right this is in the future right now here at this moment spy looks very promising the KQ is also very promising breaking the 533 resistance level over here heading towards the alltime high area around 539 okay that's our next major technical resistance and that's a technical Target as well because spy made a bottom signal over here again guess where above the 21 Day EMA above the 522 support level this double support area is clearly acting as a major inflection point for the QQ right now we are reacting very well above this key Point suggesting more upside is there any top signal no what if we see a top signal what if what if we see spy I'm sorry sorry the QQQ closing below tomorrow tomorrow we see bearish candle closing below the $532 all right that could be a top signal but right now we only see bullish evidence this is what we can work with right here right now okay right now we see only technical evidence suggesting more bullish continuation and how this affects our stocks because right now if you ask me Nvidia is not only insanely bullish but it is making a bottom signal above the 21 Day EMA above the 130 above the 129 this triple resistance level over here we are reacting very well above this key Point suggesting an upside to the next technical Target 141.5 okay now yes Nvidia technically speaking triggered our personal strategy of the trailing stop gain okay because we bought over here I gave you guys the Buy Signal on Nvidia to the members of the 5% project down here okay while Nvidia was near this support area again by near support levels this one triggered our trailing stop gain over here so it did trigger a sell over here we are not going to complain okay because it was a phenomenal trade but right now this reaction suggests more upside we are not going to cry about it because again it was a fantastic trade but if we see now from here if you are on the sidelines on Nvidia if we see any pullback to the 21 Day EMA to the 130s area great it is going to be possibly another buying signal to us okay right now let's just wait if you are still in Nvidia that's very good for you the 141.5 this Gap over here because remember guys gaps work as magnets for the price when Trends reverse this Gap is our next technical Target Nvidia is not going to get there okay we only see bullish technical evidence Nathan what if we see if we see then Nvidia is going to be a sell period remember guys again trading is reactive it is not predictive there is not a single tool in the realm of Finance or in reality that can help you predicting the future there is no such thing nothing can help help you predict the future absolutely nothing there's no AI there is no Quantum trading no fundamental analysis no tape reading nothing can help you in predicting the future but we can react properly to what's happening right here right now that's why technical analysis is here is here to help us understanding the Market's movements because again every single candle every single candle we see over here represents a different battle between bulls and bears between different ideologies and we use technical analysis to just follow the money okay because we follow the flow of the money using good strategy meaning trading using risk management knowing where our stop loss is where our Target is always having a crystal clear plan in mind before every single decision every single professional Trader knows where where they stop loss or their target are before they place the trade even before they place the trade that's how we do over here and guys remember if you want to join our educational project become a member of the 5% project because there I teach you how to trade strategically using our personal insights because I share many signals with you guys over there many trading strategies and so far we are performing so well that you can just give us a chance because you have seven days for free okay absolutely free to try then if if I'm capable of delivering valuable information to you then later after 7 days you decide if you want to stay with us for real or not but bear this in mind okay over there the members of the 5% project they have exclusive access to very very good and detailed trading strategies every single day many amazing opportunities many amazing signals every single day so if you need help devising a strategy or if you just want to improve your performance or have more trading ideas you are more than welcome to join our community to learn with us because there I teach you all for free okay you can even download my ebook on technical analysis entirely for free there I teach you my trading methodology absolutely for free okay it's free we deliver value first and then you decide if you want to stay with us or not okay again link is in this video description all right just join the 5% project because guys we retail Traders we got to stick together okay because we can't trade without a clear strategy if you don't have a plan then you plan to fail this is it okay we always got to have a very Crystal Clear plan in our minds every single time now regarding Tesla over here just like Nvidia was a buy to us over here near this bottom level I see Tesla us a very nice buying opportunity as well of course not investment device okay I'm not suggesting anything over here but but let's think about it for one second Tesla collapsed over here right making lower highs lower lows now it just reached our support level at at $326 now it is reacting from here everything is telling me that yes Tesla is supposed to bounce to higher levels again just like Nvidia did however is this a bullish reversal not yet okay of course Us swing Traders it is possible to take advantage of a swing over here of a bounce to the 21 Day ma or maybe to higher levels but uh guys a true reversal will only come if we see a higher high higher low all right breaking the 21-day EMA the exponation moving average on the daily chart then we are going to enter bullish territory again and we are going to trigger a bullish reversal chart structure all right only then we're going to see real reversal right now yes for swingy trading purposes it is possible to trade Tesla over here and I did share a trading strategy in Tesla with the members of the 5% project but uh right now we got to be very careful because it is not reversing yet okay maybe it will but right now it is just bouncing regarding AMD this one looks horrible okay because it is just collapsing making lower highs lower lows we don't see a crystal clear reversal only bearish structures AMD looks horrible simply horrible of course it this is not as horrible as watching this video without being subscriber because that's so so sad I mean because if you're not a subscriber you miss our future analysis future content that may be very helpful to you eventually you will find the necessity of watching a complete analysis of the market through the bias through the bias I'm so sorry through the lens of technical analysis without any bias because our analyses are totally unbiased okay so just subscribe to this channel for more analysis for more content like this I need more people like you over here you are watching this video for nearly 12 minutes right now clearly you did like the content so this channel is for you you are welcome to the finance Hydra Channel and remember remember to click the like button to support me as well every single like is very important to this humble Community all right now AMD insanely bearish okay not a single bullish reversal the 21-day EMA is clearly acting as a major resistance level over here so as long as we see AMD making lower highs lower lows trading below the 21-day EMA it is not going to turn bullish I'm so sorry to tell this to you guys I know you love AMD but that's true okay AMD is insanely bearish what's more to be more specific today AMD found a resistance level right below the 114 the previous support level over here now acting as a resistance level to us another classic example of how the principle of polarity in technical analysis Works previous support levels are going to work as future resistance levels and vice versa this is this is why technical analysis is so amazing right although we can't predict the future with it we don't need to all right there is no need in predicting the future because we react properly we have the odds in our favor and the TA is an amazing tool that can help us in devising good strategies okay technical analysis is just amazing don't you don't you think because I do I do it is very good now clear resistance level over here all right not reacting okay AMD is just having a very rough time right now as long as stay below the key point it will remain bearish paler on the other hand paler looks phenomenal going up insanely well almost making a new alltime high is there any top signal is there any bearish reaction suggesting that AMD I'm so sorry that paler could collapse or trigger a pullback from here no there is not a single technical evidence if we see one any pullback to the $100 could be just another buying opportunity because that's what paler is doing it rises it corrects rise corrects rise corrects rise corrects rise correct any pullback could be just another buying opportunity but Nathan paler price to earns ratio is quite High Etc first this fundamental this fundamental indicator is useless for a growth stock okay and can prove to you maybe tomorrow tomorrow I'm going I'm going to prove to you why this indicator is totally useless in trying to predict if a stock is going to collapse or not because only stating that that a stock is overvalued it is not enough it never is nearly never is okay so and I have many factual examples proving that if you want to swing trade stocks well do not use fundamental analysis use technical analysis fundamental analysis is more for investing all right and even in this scenario price to earance ratio is not applicable for a growth stock like paler period okay you got to use other Technical and the fundamental indicators okay for palter all that I know is that it is going up okay like it or not many people are uh paler is kind of uh many people are trying to sell pal many people are trying to sell paler Guys Without technical evidence stating that paler is going to correct it is is not going to be a sell okay at least of course not into me not according to my trading methodology okay in my personal humble method it is not a sale yet or maybe it will but right now it is not now apple apple looks phenomenal because uh recently Apple guys for educational purposes only okay Apple gave to the 5% projects member a Buy Signal over here which I did share with you guys Hammer Candlestick pattern followed by a PR line pattern Above This support level we bought here and we sold here near this resistance level all right now we waited for the volatility after earnings right now Appo is making a bullish reaction over here in this area and it did trigger another Buy Signal to us our members bought I gave you guys the signal to buy here on February 4 and it did trigger our Buy Signal on February 6 our members bought over over here it did drop it was a quite scary drop but in the end it is recovering Right Here Right Now what's my personal Target on Apple 247 okay that's our next Target over here maybe apple is going to get there I don't know if it will I don't care too much because even if even if we are wrong we're going to lose little okay because our trading strategy is all about mitigating our losses while maximizing our gains okay if we lose okay it is going to be a very small loss if we make money all right we're going to make more than twice as we were willing to risk in the first place therefore that's how you work strategically you trade strategically like a real professional all right we got to know where our stop loss is where our Target is and of course we have to have good technical evidence supporting every single one of our moves in this market so again if you want to learn more if you want to trade with us join the 5% project link is in this video description subscribe to this channel thank you very much for audience my dear friends see you guys tomorrow as usual stay safe bye-bye



Comments 0