
원문 보기
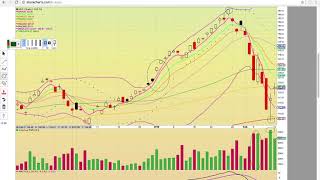
hi everybody this is Osprey from my truechnology stocks so right now you know that the the Nasdaq has pulled back and then it's it's trying to find support and and it looks like it's setting up for a bounce and so we have several technology stocks that have formed bullish reversal patterns and so if you take a look at Amazon here ticker symbol am Zn you could see it had multiple red candles in a row and today there was a nice bounce off of the middle Bollinger Band currently at fifteen forty as long as that level holds the uptrend is intact if this data Purple Line breaks the the downside risk is it could come down and test that 50-day simple moving average similar to how it did back in February today bullish one white soldier reversal pattern formed so this is a nice reversal pattern we'll see if you know it can be confirmed the closing price on the twelfth is the key level to break so that this could possibly if there's a positive reaction to the news tomorrow for to the FOMC meeting then you know this could possibly close above 1600 that's the key level and possibly make an all new time high so it you know if it fails to break 1600 you know that's gonna signal a temporary top if you look at the Amazon 15-minute chart you can see here it bottomed out on the 19th and it came back up and now it's currently trading above all the moving averages it's hitting resistance over here on the 16th if it can break above this level this red line here at the the you know in the 1587 level then it could come up here and retest the high so you can see that the high close on the 14th here is right around 1603 and so that's gonna be the big level to break that's the target to the upside if it drops below that 200 days simple or 200 simple moving average at 1579 that's gonna be a red flag it needs to stay above the simple moving averages okay take a look at NVDA okay yeah so this had a really nice bounce today as well it did form a bullish reversal pattern and so bullish one white soldier reversal pattern formed and so this was a nice bounce off of the the the a sending support and the 50-day simple moving average at two three six eight four if they can get above the closing price from last Friday that would be an all time a new all-time high close so this is setup that you know make a new all-time high clothes as well it's hitting that level it's either gonna top out here well it or it's gonna you know break out higher it's you know hitting that key resistance level that it's hit multiple times if it drops down below 240 that's gonna signal downside risk that would put the 50-day simplement an average on deck if that level breaks at 236 then you could see a big drop down to that 100 a simple moving average at 219 okay so that was the bullish one light soldier and then if you look at the 15-minute chart this had a really sharp bounce you know it bottomed out yesterday and then you know had a really sharp recovery gave but you know yeah you know ran all the way back and above and then and then now it's back here hitting that the the resistance from the 16th and then if you can get above that you're looking at the high close from over here on the 13th at 250-350 as the big level to break you know right now has a very strong uptrend on the 15-minute sharp it just needs to get through this 251 resistance level and then through that 250 350 ok let's look at Intel so Intel made it a nice bounce today as well it did form a bullish reversal pattern a couple of days ago it formed a bullish harami cross reversal pattern and so you know the doji was signaling the bounce but it did pullback lower it's trying to confirm that pattern it needs to get past the halfway point on this red candle and that would confirm the pattern the the closing price here on the the 9th is the key level to break it close above that level should signal it wants to breakout higher if it drops below EMA 13 at 50 68 that would be a red flag the orange line as long as the middle Bollinger man at 49 94 basically 50 is holding then the uptrends intact okay so if it breaks that would be a red flag signaling that that you know it possibly could consolidate right now it's intact it just needs to break out so Intel is set up to possibly make an all-time new high close as well if you look at the 15-minute chart here it is hitting this this resistor okay and the intraday a top resistance if it can break above that then you're looking at 52 is to be level to break from the 14th and then over here on the 13th way up here you know but in the 5350 range it is gonna be the big level to get above so first things first it needs to get above this 52 zone and then you know 51 50 and then 52 and then work its way higher it does have an uptrend going it needs to hold the middle Bollinger Band it needs to stay about 50 150 you know if it dropped below that would be a red flag that it's maybe not ready to head higher and then if you look at Netflix here so Netflix had a nice bounce today as well it pulled back you know with multiple red candles and then it had a nice bounce on light mount volume it was a very small candle that formed today but bullish engulfing reversal pattern formed it what needs to happen is it needs to close about am a for currently at 317 34 I guess it closed actually close just above that level and so it needs to stay above the EMA 4 and then it could work its way back up to test that that all-time high close that that's the closing price in the ninth year if you can get above that level and then you know once again Netflix is set up to possibly you know retest that all-time high close level now to the downside if it fails to hold EMA 13 you can see the orange line has been holding during the pullback on the pull backs it could come down to that middle Bollinger Band and so the middle Bollinger Bands currently at 307 59 you know the drop below that would be your big clue okay yeah the chart is broken down has broken down and then it could drop down to that lower Bollinger Band and 50-day moving average at 273 as long as the middle Bollinger Band is holding similar to how it did over here in February the uptrend still intact okay so yeah then if we look at the 15-minute sharp you can see you know it's trying to break out from this downtrend channel it's hitting the top of it and so if we can break above the a sitting resistance line and then above the 200 and 300 simple moving averages basically a 320 and above for Netflix would be very bullish if it drops below the middle Bollinger Band at 3:17 that's gonna be your red flag that it's cooling down and then the chart will be broken if it drops down into the 314 s that would be below the 50 simple moving average so it needs to stay above these moving averages and then bust above that 200 and 300 on on the 15-minute chart and that'll be the clue that it wants to head higher okay so let's look at Apple so Apple had a pull back as well and you know it had made that all-time high close it had that epic run from the the bounce off the 200-day simple moving average and then and then it came back in you know today it had formed a doji and so you know went during a downtrend when a doji forms many times that signals the the bounce is coming and so you have a bullish doji star reversal pattern from today and that's a really strong reversal pattern many times this pattern is confirmed we'll see I'll have to see if it's if it follows through here yeah it does show indecision but it shows you know tight trading there was a stalemate today between the Bulls and the Bears what levels you want to keep an eye on our EMA for at 176 45 and that middle Bollinger Band at 176 93 basically 177 so if Apple's it starts trading above 177 that's gonna be your clue okay yeah it's bullish again and then you have the high close here on the 12th is the key level to break up here right around 182 and now if it fails to get above 180 of 77 and that turns into resistance then that's gonna signal a downside risk and you could see that the 50 and hundred a simple moving average is tested down here at 172 and 171 okay that's the bullish doji star and if you look at the 15-minute chart you can see this really got driven down I mean look at look at that pullback and so what it's trying to do right now is get above the green line that that's the 50 the the 50 simple moving average at 175 and so if it gets above that level and then above the middle Bollinger Band at 175 65 those two levels that's when it signals okay the charts back and play and so you can see it almost got above today look at the volume spike in the day it looks like some people were are trying to load here for a possible rally tomorrow we'll have to see if it can follow through if it's forming candles below the the green and data purple line it signals it's a risk to hold it has to be trading above those levels to head higher similar over here on the 9th and the end 12th and the 13th when it was running over here on the 9th in the 12th you can see it was above the green line and above the data Purple Line and then as it's heading lower it's both the candles are below the green line and below the data purple line and so they're trying to get back above and that'll be our clue that it's ready to head higher okay let's take a take a look at micron here so micron did you know the markets have been under pressure and microns been pushing higher this is a really strong chart I mean look you still have RSI at 77 and Fastow at 87 it did not correct it's still riding EMA for support higher this has been an epic run as long as EMA for at 60 27s holding the signals to keep riding you know it just signal that the chart is super strong if that breaks then you could see it pull back the test EMA 8 at 582 you could see today closed above the closing price from Friday that signal is more upside potential okay so that that was exactly what the Bulls wanted to see and then now you have the 62 level as the next big level to break so yeah this is a really nice move by micron it keeps pushing higher so Congrats everybody yeah it does it did form the bullish kicking pattern here yeah but basically the bottom line is is that this is pushing higher it's got a nice uptrend as long as in May for holds the signal is to keep writing ok let's look at Facebook here so at Facebook you had a big pullback I want to show you this chart so you can see that this 300 a simple million average clearly so it's bouncing right now off of the blue line and that's the 300 a simple moving average at 161 7 look at that huge volume here so it does look like there were bottom feeders off of this 161 162 the 162 zone and so well if that level holds this could be where it gets the technical bounce notice today's candle is floating below the lower Bollinger Band the lower Bollinger Bands way up here ok so when a candle is forming the well below the lower Bollinger Band like that that signals it's an extreme oversold condition if we look at fast o here you know you can see it what did it did bounce though it is at 25 on Fastow well that's because the long lower on today's candle they drove it up and so that signals that that you know that even though it was down on the day the bulls were strong into the clothes you know they closed it closer to high up day than they did towards love day you know there was bottom-feeders and so what you're looking for now is the candles working back into the bands and then you know this 200 days simple moving average at 170 to 61 is going to be the big resistance level to get back above if that turns into resistance you know that that could sing will the top of the technical balance and then and then it could continue writing EMA for resistance to lower so basically it has to hold the 380 e 200 a simple luminara's to get the reversal going if we look at the 15-minute sharp you can see here that it you know had the big gap down and so you have the the the space between the the low of day on the 16th and high of day on the 19th and so they drew it drove this thing down and then now it's getting above the middle Bollinger Band it's above the dot of Purple Line and so that's this how you start a reversal it tried to get above the data purple line on the last candle of the day yesterday but it failed to hold with that gap down and and you can see the gap did fill with this upper wick with these two wicks fill the gap and then yeah and then it worked its way back up so basically what all you need to know is this green line right here okay so 169 all right if you see facebook training above 169 that should signal that the bounce play is happening and then and then you could see it run up to the the bottom of the gap and notice how the bottom of the gap is nicely lined up with the hundred simple moving average zone I guess the hundred simple moving average is a little bit below there but those would be the two targets would be this 176 to 177 level and so you could see a run between 168 and 176 and still have the the daily chart you know still be a piece of junk but but you could get a nice technical trade you know that could that's so good you know if you if you're writing some calls between there that could make some nice money so let's keep an eye on that and then this look at Google here goog L as you can see here it's bouncing as well it had the big pullback and so it's hitting the 100 a simple moving average at 1085 if it can hold that level then it could get the reversal going you know it could work its way right back up to this EMA 4 at 1:13 1113 it needs to get back above that level in the middle in Japan to get that uptrend going if the middle Bollinger Band and in the 50-day simple moving average basically at 11:20 you know remain resistance that that's gonna signal you know possible downtrend has to get above those levels to get that uptrend going again you're gonna know whether or not the charts breaking down by whether or not the Gold Line holds you know that that's this a hundred a simple moving average if it breaks the downside risks that comes down to the 200 a simple moving average and test support okay so if you look at the Google 15-minute chart you can see here it's trying to get the reversal going you know it really channeled out down here you know it formed a tight channel you know trading for the last two training days basically and so now what it needs to do is break out about the top of the channel it's trying to break above that the 50 simple moving average it's trying to turn the middle Bollinger Band that's the data Purple Line at ten 9450 into support and then it's trying to get above the Green Line which is at ten ninety six and so if it can get about both those levels that's our signal that okay yeah it this is the start of the reversal and then it has to stay above those levels and then it needs to get above the high close of the channel which is right up here and then it once it breaks above that level at 11:02 or so then that's gonna be your single it's ready to head higher and it could you know retrace back up to that hundred simple moving average at eleven twenty basically 11 1977 and then to this guy no the how that is lining up perfectly with the gap or with the you know the 100 simple moving average is lining up perfectly with the bottom of the gap so you have a gap between a low of day here in high of day here and so yeah you could see if the 50 simple moving average turns into support that then the trade is between the this level and this level or maybe the top of the channel in that level okay but above 1100 to 1120 which would be a nice trade and then if you look at Debbie twtr and then you know think it's above the gap and then it could head higher but we'll talk about that later and then this will get Twitter here so Twitter got really crushed today on that Israel news and so yeah it seems a little overdone down 10% if you look at fast oh that's an extreme move you know previous let's see what happens previously you know when fast Oh got down here before you know it bounced pretty good so right now you know if they shake it out a little more it is on a four day drop notice it did get the lower wick off of the lower Bollinger Band there so there were some bottom feeders basically it you know you shouldn't get a technical bounce off this 50-day simple moving average you know it bounced off of that level in January when it got hit so I would be looking to load in that thirty to twenty nine fifty the thirty support zone you know it could try to bounce off of thirty-one here you know it's got four red candles in a row a big volume spike today it looks like some people were loading it keep in mind if it's if it's fails to get back above that middle Bollinger Band at 33 88 that that could signal the possible start of a new downtrend to the upside I think it's a nice bounce you know you could possibly see this kind of move I don't see it getting right back above it's gonna take a little work to get back up there but but yeah but it look for a bounce it's got a setup for a technical bounce very soon possibly tomorrow and then if we look at nap here okay last one in this video so this is pulling back it has four red candles in a row and so it looks like the target here it is right here at the at the two hundred and one hundred a simple moving averages basically if it hits that 1534 1535 level that that should be the technical bounce level not sure if it's gonna get there you know maybe when the feds talking tomorrow you know that you know they'll pull these things down further and then in the maybe it'll bounce you know that it looks like they're trying to bounce right now it is performing today's candle did form below that lower Bollinger Band so the candles couldn't work back into the bands and what it needs to do is get above EMA for at 1658 once it gets above that level that's when it can get the reversal going it has to get above the middle Bollinger man at seventeen forty seven to get a new Uptrend going notice how the data Purple Line how it's been resistance all through here failed to break so so yeah and that that signal that the downtrend was intact and so right now it's in a downtrend but it's hitting this level where I could get a technical balance and so yeah keep an eye on 1550 the $16 you know basically if it hits that fifteen thirty level I bet you you're gonna see some buyers okay thank you very much for viewing this video if you'd like to please com thank you


Comments 0