원문 보기
Tom Lee and BMNR, Tom buys more today of Ethereum through his company BMNR and about 25,000 ETH. Michael Saylor says back to business as usual, so they continue on with their plan to buy Bitcoin. And the support level of Bitcoin is around $59,000. We will see if it stays there, but more importantly not tax advice, not financial advice, not legal advice, but I'm going to get into the moves that I'm making right now.
And just do some just basic looking at where is BMNR right now? Where's MSTR right now and how I'm looking at it for the future, okay? So, let's just take a look here at the charts and see on BMNR in a very simple way like what is happening, okay? And you don't have to be a trader or chart technical person to understand this stuff, okay?
So, first thing is to just look at this. We're on a daily chart here. This is TradingView and InvestAnswers is the charts I'm using. Kudos to them. And if you look here on a daily basis with BMNR daily daily the daily charts show you moves that are made over longer periods of time. So, if you look here, the last time that BMNR was like more bullish on the daily meaning it was blue.
Blue is bullish. And it turned yellow. It started to turn yellow kind of right around this area here. Right around $21.25, which was a signal from just an investment standpoint for me to get out and ride it all the way down and you'll see now Bitmain or BMNR is sitting at $16.04 right now after hours.
So, just that signal to follow the daily that said at $21 and change get out and now it's at a 25% drop from that signal or even, you know, close to a 30% drop now. So, so just following this pure like, you know, investment chart analysis is what I look at, uh is I look at the daily chart. So, my next move on BMNR in terms of entering it won't be until this chart here where you see this yellow turns blue.
And we're a little ways away from that for sure. Um but when you see like BMNR down below this green line here, this green dotted line, it that's kind of like buying territory, so to speak. Not that I'm saying anyone should buy, but that's where it's like pay attention. Um we could go lower, but it's like very far away from its average.
And so, I will wait for these daily charts to turn blue to where I get back in. And when they do, I think BMNR will start to make a higher run up. Now, that could be weeks, that could be months, etc. But the point is when these daily charts signal, it means pay attention because, you know, one could have just made this move here around 20 $1 and change here and just literally sold out of the position and picked up 20% more shares by buying back in.
And for me, I'm in cash right now, so I'm not buying back in at any time for BMNR. But when it does turn blue, that would be a signal for me to trade it or buy back in. Make sense? Now, quicker moves that I can make on this um are also following the 2-hour. Now, if you look at the daily and you look at the 2-hour, they're both bearish.
So, I'm going to click to the 2-hour. The 2-hour is yellow, too, and they're both bearish. But in looking at the 2-hour, this this is where I can make quicker moves on the on BMNR while it's sitting in between $16 and 22 or $23. It goes back and forth over the last 5 months. There was a signal the other day.
If you just look at the 2-hour, like there was a signal to get in here where it's blue and it was a brief signal to get in and you could have rode it up and picked up some gains here and then there was a signal to get out when it goes blue to yellow here. Um where one one could have gotten out right around $16.80 or maybe say $16.70 and then rode it down and now it's sitting at $16.
And even if we waited for it to get a little thicker yellow over here, let's say I just traded the 2-hour and I got out around $16.50. I could have sold out, rode it all the way down and then I'll wait for this signal to turn blue again to get back in. So this is just some basic like understanding of how BMNR moves um by watching the daily charts and the 2-hour.
The 2-hour are clearly a shorter time horizon but the the daily is a longer time horizon. So when these two are bearish, like it's not good. Um and so that's just the main thing to look at. So I'm I'm hoping that BMNR one day, you know, maybe 2 weeks, maybe a month, who knows will turn back more bullish.
It could be a couple months on the daily which is this and then I would make some moves and then buy into it uh and then hold it as it runs up on the daily. So that's where we're at with that. Now if we look at MSTR, MSTR is very similar. If you look at MSTR, the charts on MSTR we can see some really cool things to learn about MSTR here.
Uh and just see like where was the signal for MSTR to get out and then when might be the signal to get back in. And again, this is just for me and I'm just using this from a theoretical standpoint but uh here uh MSTR on the daily. Again, the daily does not change much. So as an investor, like this is like gold to just use this daily chart.
You can see it stays blue for a long time and it and and it stays blue and then eventually it goes yellow and yellow just means bearish. So right here, you know, MSTR was signaling around 175. Let's call it somewhere between 100 between 175 and 165 dollars to get out. And so now we're riding it all the way down and saying stay out stay out stay out stay out stay out and we're at 116 bucks.
So that that could have been a 40% move to just follow this chart, sell out when it was at the top, and then wait for the signal because we could go lower and this is like slanting down on the daily. So this is definitely bearish. You look at the trend of the yellow line just slanting down. We could definitely go lower.
And so I won't enter back into MSTR until it bottoms. Um and this could be the bottom, but I won't enter back in until this chart here yellow with the yellow line goes blue. Um and you know, I I may you know, one could speculate and go hey, this is the bottom. I could get in, but I'm not speculating about it cuz who knows MSTR could drop down below 100.
So the way to for me for me not to speculate about it is just to follow this, right? Cuz it's very clear. Um you know, and here around 170ish something with the signal starting to to flash to get out of MSTR. And you can look at how accurate it is on MSTR. It's like if you look at the time to get back in um when we first started to have some bullishness and I was actually showing this if you go back and watch my videos on this.
I was showing everybody hey, on the daily charts when MSTR was at 129, I'm like this is the first time we're bullish in a while on this I'm paying attention to this. And at 129 was the signal to buy in right around there 129. Call it if you want to be safe, call it 133. 135. We can even just be super conservative.
And uh the signal says get back in and then it got you could have rode it all the way up. Now, MSTR topped at 195. Now, per these charts, I wouldn't have exited at 195 cuz I would have waited for this chart to turn yellow, which is more around the 175 mark. But, those are just the signals on how to actually um uh how I make decisions on investing in these things.
And this is over a couple month period. Sometimes it could be 3-4 months on the daily. Um the signal for the daily for MSTR to get out way back in August was at $400. And then the signal to get back in new flash to 160, which is months and months later. So, one one could have saved themselves a tremendous downfall on that.
So, that's why I use these charts. Uh these did This is from an investing standpoint. You don't have to be a trader to understand this. You can just look at this. Look how clean this is. Like what Look how Look at this. It's amazing. It's like, "Stay out. Stay out. Stay out. Stay out. Stay out." It's so clear on the daily.
Now, if I wanted to make decisions in a shorter time frame, I would just go over to the 2-hour on MSTR. And I I made I made a a boo-boo on this today. When when the 2-hour is yellow and the daily is yellow, don't trade against it. I tried to trade against it today and I lost a little bit of money doing it because when I trade on a daily, I trade the 3-minute.
And the general rule is if the 2-hour is yellow and the and the daily is um yellow, uh trying to like and not bet against it and trying to like bet that this thing's going to go up, MSTR, it's a hard one to win if one's making decisions on the daily bit on the like 3-minute charts or 5-minute charts.
And that's a whole 'nother story. So, 2-hour, look how bearish it is. Daily, look how bearish it is. It's like it's almost a telegraph to say, "Hey, this thing's going down." And what did it do today? It went down. Now, you might be going, "Ted, well, the other day it went up." But, yeah, let's take a look at the signal here.
Cuz if you look at the signal here, this was the other day. You remember when it went up? Oh, look. We were bearish, bearish, bearish. And then all of a sudden we got this blue signal here that MSCI is going up and what did it do? It made a nice little run up. You can see on the blue. One could have gotten in.
A nice little run up and then the signals to get out again. So that's for just shorter like short time periods. The two-hour might update every um it might update every week um once a week maybe sometimes twice a week. You can also see on the two-hour when it went bearish uh look how bearish it was.
The two-hour just gave the indication too. God, you know, look at this. And the two-hour was screaming get out right here around $155 recently. Um and so one [clears throat] could have made that move, too. And it rode all the way down. Look at this, all the way down and we hit 119 at that point. So this is no joke.
Like this is super this is superior uh chart analysis here um and it's just like sitting here hoping and praying that these things are going to go up or that it we're going to have a bull run. You know, we'll know when we're having a bullish time by looking at the charts. Why guess? Why listen to all the headlines?
Why speculate? Why not just look at the analysis? Now you can use headlines to guide decision making to be like, "Hey, you know, we may have a bearish day today because Trump announced XYZ." You totally use that, but you just look at the charts to confirm it. The charts are the senior data one wants to look at.
So this is really great stuff to look at. Again, this is not for if if this is not for like quote unquote like trading for somebody who wants to day trade on a daily basis what I'm showing. This is just to make smarter moves and uh I share this technology cuz I wish I'd had this stuff years and years ago um because you just look how clear the signals are.
Like wouldn't we all have liked to know on the daily chart with MSCI here um you look at this. Like we traced it all the back way back when we have liked to know that it turned bearish at $400 back in August. Yeah, when we would like to know that BMR um same thing in in October, it turned bearish at $54, $53 and went all the way down to the $20-something range and there was no signal to get back in until then.
So, this is just pure investment like mojo here that makes the most sense for one to pay attention. So, if you want to get access to learn more about um how I use these charts more frequently, there's a video down below. You can go click the link uh and you can download that video and watch how I do it and uh also my book Money Game comes with it, so you can snag that as well.
But, this has been a passion of mine to share this because uh we know long-term at least I know long-term MSTR and BMR are going to be incredible winners from my viewpoint over the next 4, 5, 6 years. But, while they're in limbo right now, you know, we we could be uh in another part of the bear right now where it gets worse and that's always a possibility.
So, having the charts to show us what's happening makes a lot of sense and then also when we do get into a bull run again in the future, my main focus is like how do you manage the volatility cuz even during bull runs, you know, we've seen MSTR go up. I remember 2024 uh when I was holding the stock, I remember we went up to 2,000 before the stock split on MSTR and then we went all the way down to $950 in a very short period of time and that was during the bull run.
That's 50% drop. So, MSTR will have 50% runs up and 50% drops is my viewpoint in the future. I think 4 years, 5 years from now, we'll still have the same thing, maybe a little bit less volatility, but understanding it and uh and planning for the future using good data-driven analysis makes a heck of a lot of sense rather than just hoping.
And that's been my strategy is to not hope and to actually use data moving into the future. So, these charts tell you a lot about it. You can get the video down below um to to walk you through more of it. And in the meantime, I'll I'll give you a few updates on what's going on with Tom Lee and Ethereum right now.
Um they're buying more. And so, they bought another 25,000 of ETH. Uh Bitmain's increased its Ethereum treasury uh to with a $42 million investment recently. And the purchase came immediately after VMAR's latest weekly treasury update. So, VMAR continues adding ETH despite all the volatility, despite the drop, Tom Lee's looking at it as a buying opportunity.
Um and their strategy has not changed. They're going to own 5% of the ETH supply. Uh so, there's there's a lot of investors that are cautious and rightfully so. I mean, Ethereum dropped into the 1500s. Um and now it's down below 1700. Uh the market sentiment is definitely weak right now and things are volatile, but the company uh appears to view E- Ethereum's drop as a pullback opportunity, so they continue to buy.
And I think for their long-term strategy, what they're doing, they're super smart in buying and doing what they're doing. Because over the long term, VMAR is going to be a phenomenal phenomenal stock. Long term being 4, 5, 10 years. So, uh they aggressively accumulate Ethereum and of course, the broader market is cautious right now and they have a right to be.
But, Ethereum's real story isn't price, it's adoption and Ethereum leads the tokenization race and that's why Tom Lee's so confident in the future of Ethereum because of stable coins, tokenized funds as we all know, and commodities and stocks. It's the bottom line. The traditional finance world is moving onto the blockchain and continues to move onto the blockchain.
So, the largest real-world asset markets continue expanding on Ethereum and that's why long-term, it's bullish for Ethereum and VMAR, but in the short term, it's in the crapper. Let's not sugarcoat it, okay? So, that's what's happening there. Um let's get in a little bit here and let's talk about uh MSTR and what they're doing.
So, MSTR stock jumps as Bitcoin recovers. So, it jumped a little bit today and then it dropped back down. After hours, it's around 116. So, um it jumped a little bit the other day where it went up to what, 126? And now all the way down to 116. So, Bitcoin climbed back above 61,000, hit about 62,000 after hours.
Um so, we're seeing that. But, Strategy now controls roughly 4% of Bitcoin's total supply. So, if you just see the playbook, we know that BMNR came out with their preferred stock recently and they came out with the announcement that they're going to um do a do a raise for this preferred stock. And um and so, now they're copying Strategy's playbook to a T.
Uh BMNR is going for 5% of the ETH supply, Strategy is going for 4% of the Bitcoin supply. And Michael Saylor says business is good as Strategy's Bitcoin treasury reaches 845,000 Bitcoin. That is a lot of damn Bitcoin. Roughly 4% of Bitcoin's total supply. Now, I think the the hit the fan the other day when he sold about 2 and 1/2 million dollars of Bitcoin to make some different payments, I think dividend payments they're making.
And to kind of restructure some things that they're doing. But, uh Saylor's not um stressed about things. He's calling it business as usual because his strategy, and pun intended, I guess, for his company Strategy, is brilliant. It's just flat out brilliant. And so, what they are doing in the long term and what they're doing now to build for the long term, I mean, this company is unbelievable.
Now, that does not change the fact that the stock is extraordinarily volatile and it reacts to anything, good news, bad news, neutral news, uh it reacts and it moves and it's incredibly, incredibly volatile. So, my viewpoint on it is long-term, it's great. Short-term and through the next 3-4 years, it's a roller coaster.
And so, that's why I look at charts like this and I analyze charts like this on MSTR. I can tell when it's bearish and when to stay out of the stock and I can tell when it's bullish and when to get in and make some moves to make some income and and money off of it while it's being volatile. That's always the goal, okay?
So, charts like this are helpful. Again, you can get that down below. If you want to get access to the technology, you go to TradingView and InvestAnswers. I have no affiliation with them. If you want to access to how I utilize the charts, there's a video down below for free, okay? So, it's no secret that Saylor's got a great strategy behind him and he's brilliant at what he's doing and the future is bright.
Most people still don't understand it. I I do often do a test talking to friends at parties like, "Hey, do you know what MSTR is?" I was doing this with a friend the other day. He's like, "No, what is that?" Uh and they don't know. And and then there's other people I know that are relatively informed of stuff like, "Do you know what They know what MSTR is?
Do you know what BMR is?" No. So, this is such a new wave of finance, let alone Bitcoin being a new wave, even though it's been around for a while, it's still so new to the general public. And when you think about MSTR, I mean, and you say it to somebody at a party, they're like, "Mr. Who? Mr. Who?" They don't They have no idea.
The general population, general public is clueless when it comes to this stuff. So, we're still so early and it's still so new development of these companies. So, Saylor says, "Business is good. My strategy remains committed to his long-term Bitcoin accumulation strategy despite recent market turbulence." So, he's acknowledging the market turbulence.
Ultimately, he doesn't want to share holders holders losing money, but he doesn't care from the long-term viewpoint of uh he's just going to continue to buy Bitcoin. So, he's not influenced one way or the other by the market dropping. He's just going to continue to buy Bitcoin. Now, if if Bitcoin dropped down to $8,000, Strategy might have some major concerns, but at this point, I don't think we're going to see an $8,000 Bitcoin, and as far as the future's concerned, I don't think Strategy has too many concerns.
Despite what the headlines will say or the media will say or people say, "Oh my god, they just sold some Bitcoin." The their their game plan is rock solid, man. Again, stock is so freaking volatile, man. I've been I've been involved in the stocks since 2020. And not only that, I've fallen. I bought my first shares then and sold them.
And bought again in 2024. So, it's really like one of these things that you just got to You got to understand Bitcoin first before one even starts studying Strategy. So, is Bitcoin nearing its cycle bottom? Is the question. Has Bitcoin finally reached the bottom, or is there more downside? Well, it fell 14% last week.
The current correction is 53% from the cycle high. The price action resembles a little bit the 2022 bear market structure. The market's now searching for the next support level. So, historically, Bitcoin has often found its cycle bottom near the 200-week moving average. And so, Bitcoin tested the 200-week moving average recently.
Um and uh we'll see what happens. And the current 2-week 200 uh week 200-week moving average support is around 59,100. So, we know we touched that, and it bounced off that, and now it's sitting around 61,000 and change. So, this definitely an important level to watch for sure with Bitcoin. Um and you can take a look at just the the the Bitcoin correction in 2022, and look at the graph in the Bitcoin correction in 2026.
The correction, if you can't see the screen, was 78% correction in 2022. Right now, we're at a 53% correction. So, we're we're definitely, you know, far off from a 78% correction, for sure. Um that's that's for sure, because like uh yeah, a 53 to 78 is a long way, but you know, we'll see what happens.
Could we go lower? Yeah. Do I think we're going to have a 78% correction? I don't think so. Okay? So, looking at the prior market cycles, Bitcoin often bottoms roughly 1 year after a major market top. So, Bitcoin could bottom um if history repeats itself, it it it could bottom around October 2026 if history repeats itself.
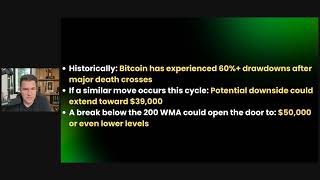
Who knows if it's going to. This is just comparable data, so we'll see, right? So, it doesn't guarantee another decline, but it remains part of the historical road map. You take a look at it, you do what you want with it. Another warning comes from the previous death cross corrections. Historically, Bitcoin's experienced 60% drawdowns after major death crosses.
If a similar move occurs this cycle, potential downside could extend towards $39,000. Okay? Now, this is just basing this based on past historical data. One could assume that with institutional demand, with Saylor buying way more than ever, that we we may not have that. Um but, it's always a possibility to just be mindful of uh of what could happen.
Now, if we go look at the charts on Bitcoin, we can just swap this out actually and go look at Bitcoin on the charts. Um this is a it's a better just indication to pay pay attention to Bitcoin on the charts because uh let's swap it out here. So, if we look at Bitcoin here, this is the 2-hour charts.
So, somebody was trading the 2-hour charts on Bitcoin. There was a clear signal around 63,000 to get out recently. But, uh on the daily charts is the thing that's much more interesting to pay attention to cuz the signal for Bitcoin to get out of Bitcoin recently was around was below 80. So, if you see this, like we were we were and this is not like a thin blue.
We were bullish as hell, right? And I was showing these charts 4 months ago. Check Go check my videos. Uh I was showing these charts of when to get in Bitcoin, not telling anybody to do it, just like, "Hey, the charts are showing that this is a good time." And it was at 68,000 of the time that the chart turned blue and bullish on Bitcoin.
And then showing these charts here of when we went from blue to yellow, we started getting bearish was right around here, $78,000 or so. And so now we're we're down what? Like 20-something percent from that? Um so that was a 20% move, and there was no indication whatsoever to get back into Bitcoin. And that that indication came here.
This was on May 16th. So we're talking about This is gold, man. Saving oneself 20-25% corrections by just understanding these charts. Insane. So now we're way below this we're below this green dotted line, which tends to be like Yeah, this is a signal where it it it's away from its its uh its average price down here.
And so this is just a signal to pay attention. It's not a signal like, "Hey, let's buy." Uh it's just a signal to pay attention. But really like it's we're it's bearish on the daily charts, and only when this turns blue would I consider getting back into Bitcoin. Um and I'll know when that happens. Uh I I prefer trading with strategy um over trading with Bitcoin, cuz strategy is more volatile, so I can make bigger moves with it.
But um but these are just interesting charts to look at. Like look how accurate it's been, right? And you look at the daily like be so good to know this, cuz look, it tells you what to do. Look at that. And look look how it's blue. Like it doesn't get more clear than this. When it's blue, it's blue.
When it's yellow, it's yellow. Blue means for me stay in, yellow means get out. Look. See? Okay? So pretty interesting, right? So there you have it. Uh again, you can grab uh if you wanted more in-depth of how I use the charts on the daily daily basis, how I interpret them, you can go get the video down below for free.
Just click on the link and you can get my book and my video for free on how I use it. And then hats off to TradingView and InvestAnswers cuz this is their software. So, great tech. All right? So, that's that just shows you like how to look at things from the viewpoint of like, okay, we could look at Bitcoin and just go we could listen to like, you know, the the the media or analysts and data that's been pulled here that shows, oh, okay, well, it's potential based on, you know, based on last last time's bear market, we can look at this and say Bitcoin has experienced 60% drawdowns after major death crosses and like the potential is for it to go down to 39,000.
We could just like speculate. It's good data have to look at historical, but this data really means nothing without looking at current charts. Like, what what am I going to put more stock in? What's happening in present time or what happened 4 years ago? So, it's always interesting to look at 4 years ago cuz Bitcoin has run in cycles and that hasn't even changed um, this.
We just hit another bear. So, it's always interesting to look at the past and understand and observe the data, but the more relevant data is what's happening right now on the charts. You know? And that's that's the for me, that's the better thing to do, which is why I share this with you guys, okay?
So, um, so we'll see what happens with uh, you know, with the price. I'm just going to watch it and I'll report on it to you guys and when I see Bitcoin turn uh, bullish on the daily again, I'll let you know, hey, Bitcoin's bullish again on the daily, which is proven to be very accurate, okay? Uh, everything revolves around this level, um, in terms of just uh, looking at historical past and also looking at two 200-week moving average.
The 59,000 is the support right now. Um, so we'll see if we if we go below 59,000, it could spiral down a lot more, okay? So, the bullish case is that support holds um and the selling pressure fades away. Again, we'll look at the charts to find out what's happening. Bearish case is support breaks and the correction deepens and we go further down, okay?
So, it's pretty important technical technical level to look at. Um we'll see what happens with the news. We'll see what happens. We know Saylor's going to keep buying. We know Tom Lee's going to keep buying with BMR. But, despite the fact that they're buying, that's why it's it's it's important, I know for me personally, to uh admire what they're doing, love the fact that these companies exist, uh give kudos to them of like the long-term vision of what's going to be 4 5 years out into the future, but it's very different to watch an institutional investor versus being a retail investor.
It's a very different scene. One has almost unlimited capital and the ability to raise money at any given time and buy the dips versus an individual who doesn't have that unlimited reach. So, an individual is different. And then, an individual would technically probably make smarter decisions to make decisions as an individual versus following what an institution or a Saylor or a Tom Lee would do cuz they can make different decisions.
Um and so, that's why data is really good to make decisions and to analyze it based on one's own personal situation, not anybody else's situation. And that's how I look at things, okay? So, I hope this serves you guys. Uh I'll be back later this week to report more on it. If you want to If you want to learn more about how I use these charts to analyze what I was just showing you today, then go down below and get the video for free.
If you're not part of the channel, on this channel I cover MSTR, BMR, Bitcoin, Ethereum. Uh and I've been covering this for the last, I don't know, 18 months or so on the channel. And uh you can look down below if you like the and and comment thing you talk Hope you have a great day. Well, and uh things turn around uh as it's been a little been extremely rough over the last couple weeks, okay? All right, everybody, stay very well.




Comments 0