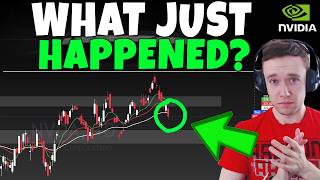
저자: TheTeslaGuy · 외국인
요약 보기
CPI 상회와 CoreWeave 부채 우려로 반도체·위험자산 급락. NVDA는 221.30 마감(-3%+), 고점 대비 약 9~10% 조정으로 과거 패턴과 유사하다며 저점 지지(216 피보나치 부근) 가능성 언급. 주봉 상승추세선 이탈 전까지 강세 우위 유지. AMD도 9EMA 부근 지지 후 반등 기대, AVGO는 320 지지 유지 시 강세 신호로 봄. TSM 실적·PPI 결과에 따라 주간 캔들 반전 여부 주시.
다듬은 글
Hello everyone, how are you, and welcome to another Nvidia update video. So, let's talk about Nvidia. Let's talk about the market. I mean, today is a pretty crazy day. We had PPI, of course, which came out...oh, sorry, there was CPI this morning. We will have PPI tomorrow morning. The Consumer Price Index (CPI), released this morning, came in slightly higher than expected.
And there was also news about CoreWeave, which actually says that they have large debts, pay high interest rates, and may go bankrupt. This is, in fact, what became known today. And that caused a lot of trouble. Everything that has anything to do with risky assets or semiconductors just went down dramatically , right?
So let's talk about it. I will share my thoughts. If you like the content, all I ask is that you click the " like" button. Of course, this is not financial advice, and I am not a financial advisor. But I share my thoughts with community members every day, friends. Join us. Constant updates of the charts again and again every day.
So come visit even on days like today. I offer three different subscription levels. Three dollars or, sorry, the third tier for $9 per month . Don't use your iPhone. You will pay more if you use an iPhone. Apple takes a higher commission. For your information. But, despite everything, join in, friends.
I'd be happy to see you there. Every chart I publish is available to level three members. They get access to all of them, and I publish quite a few. Many promotions are discussed and published every day. But Nvidia closes the day, you know , again, can't avoid this, let's say, pain in the sector. Closing more than 3% lower on the day, at 221.30.
So it's a little deeper of a drop than I expected. Of course, I personally wanted to see the level around 220-225 continue to hold. But I still can't say that this is anything extremely unusual. You know, it's still within the normal range. Do you understand what I mean? Let me explain why. So, again , using the same model as the last few days, right?
Again , here we had a model where we also had good growth and then peaked, bottomed out, and bottomed out again, right? Or fall after fall, right? And then they both fell very aggressively, almost non-stop. It just seemed like an aggressive collapse, and I thought, "Oh my god, this has to be the end." Nvidia—that's it , right?
And in both cases, if you go back to those moments, or at least my videos, or try to remember the mood, you know, they were all similar, right? They all seemed like, “Oh my god, this is impossible. This is the end. It's over, man. " That's it, the end." Yes? The feeling was the same every time . But the most interesting thing is that again, both of these dips, including the one we're in now, which is a similar reproduction if you will, came after a higher high, first of all.
So, this is the highest maximum. This is the highest maximum. Aggressive drop, aggressive drop to a higher low, right? Ultimately, these are all higher lows. So, the structure still remains "bullish ". This is the most important thing. Let's just put that aside. The second interesting thing is that they both dropped to support levels, and the SMI was near the very bottom.
SMI is still near the bottom. They also usually need about 3 days of trading in that range around or below the 45-day EMA, which is this white line here, right? We're, you know, probably on our second day here, maybe, right? But the third thing that's also interesting is the percentage of decline. From the high of this candle before the start of the decline to the low that we reached before we started the reversal, the decline was about, yeah, I would say, about 9%, give or take, right?
About 9%. Okay, great. Let's look at this case. From the highs here to the lows here, the drop was about 11%, right? What are we doing now? Judging by today's low, we have almost 10%, about 9.75%, right? So you see that we're, you know, within the same correction zone, if you will, right? Where they both do the same thing .
These are both aggressive falls. Both are in the range of 9-11% at this time. Is there still some room for further decline? There is, right? We will talk about the next downside target if there is another move down. Um, but this should hold up , by the way. And the SMI indicator is here. So, it's almost a copy of the same model.
Does this mean that everything has to happen the same way ? No, of course not, right? Nothing is guaranteed in this market . It's all a game of probability. And now this probability seems similar, you know, based on the other two examples. So we'll continue to watch, but the thing is, I still can't be bearish .
And again, let's not forget, we were talking about the warning signs on Friday, or we were talking about the " shooting star," as it were, the weekly candle that formed at the close of last week, right? And we said that this would be a problem and it could cause some weakness next week, at least at the beginning of it.
It's taking a little longer now , right? We've already gone through the first 3 days of the week. So let's see how tomorrow goes, given the TSM reporting tonight and PPI tomorrow morning. Let's see if the "bulls" decide to show up. But like I said, the last few times Nvidia has formed a shooting star candle, it's also fallen to the nine-week exponential moving average, almost like we're at now, and then just skyrocketed, right?
So, you know, she does pretty much the same thing . She did it here too. It fell to the nine-week average and then continued to rise . So, we do pretty much the same thing . We, yes, we are practicing the " shooting star". We are observing this weakness. But Nvidia usually recovers from such weakness fairly quickly, all things considered.
So we'll continue to monitor whether that changes or not , right? Will this pattern continue to repeat itself in the future or not? As I said, is there still room for decline? There is, right? So I'll take the Fibonacci levels from the low here to the high here. We're still roughly hovering around the 0.618 Fibonacci level, that's that green line over there.
But my downside target , as a maximum, what I would like to see, I would prefer not to go much lower, ideally it would be to reach the green Fibonacci level at about 216, give or take, right? It's like, " Hey, okay, you know, yeah, we can go a little lower, but I'd rather not." But if we go, it would provide a pretty strong risk-reward opportunity, at least for a minimal dead- cat bounce.
However, we will continue to observe. But that's how I'll continue to monitor Nvidia . It's actually very simple. And again , so far we are repeating the same pattern as in the two previous examples , where we had a "shooting star", dropped to the nine-week average, and now we will see how the rest of the week goes, taking into account the PPI index tomorrow morning and the TSM report at night.
So, many more factors can change the market for better or worse. We will continue to watch. Now about the bearish scenario. Let's just talk about the bearish scenario. Do you know what would have to happen for Nvidia to become bearish? You know what would have to happen for Nvidia, TSM, etc. to really turn bearish?
You know, so that these companies finally enter a fairly significant correction. Do you understand what I mean? What should happen? In my opinion, this is the trend line. If this trend line on Nvidia ever gets broken, which again right now, if it happens relatively quickly, it's about But it depends on when, of course, because this is an uptrend line, right?
So the longer it takes, the level we don't want to lose will gradually increase. But if I ever see the weekly chart start to lose that trend line and we close below it, then I'll potentially think, " Oh, okay." Um, you know, we could really have problems here, and the market could start a deeper correction.
Uh, that could be a problem, right? That's when I'll most likely at least stop being so optimistic. At the very least, I'll go neutral, if not bearish, right? But again, we are still far from that. The Bears still have too many levels to go through. While it's not impossible, of course, anything is possible, especially in such a crazy market.
So I'm not going to, we can't completely rule out any of the scenarios. Although I am not an " eternal bull", but I am 90% bullish, I am not going to completely ignore the bearish risks, right? But it's also worth understanding that the " bears" still have a lot of work to do to achieve this, right?
There are still many support levels they need to overcome to start the Nvidia stock crash, and that's not easy, right? It's not easy to collapse stocks like Nvidia. This, this, this, this is a pretty steady action, let's be honest. So we'll continue to watch how things develop, guys. But that's kind of the general perspective I'm still considering regarding Nvidia.
And overall it's still repeating the same type of pattern that we've seen in the past, and we're now in the 9 to 11 percent range, as we have in other cases. We are now almost at 10%. So we will continue to monitor this in the future. AMD. So AMD is also in a similar situation, right? I told you the same thing about AMD.
Uh, on the left, you know, we had a nice shooting star , the price dropped to the 9-day exponential moving average (EMA) , and then we saw a nice recovery. Er , actually it does the same thing as Nvidia. Nice shooting star also to the 9 EMA level, retesting previous historical highs as potential support here.
And now we just want to bounce back from this nine-week figure, well, like last time. And that's what I'll be watching for, again, the same idea with the 45-day EMA on the daily chart. This is almost the same as the nine-week average. The 45-day average is the nine-week average. More or less, or pretty close to it.
Same idea. We want, we want to continue to maintain this level. You know, maybe we'll go down a little bit to close this gap here, around the 560 level. You know, it's not something I can completely rule out. But, you know, this is an area to watch for any signs of a "bullish" trend, any signs of support, for the " bullish" candles to start appearing: the hammer , the "bullish harami", the " bullish engulfing", which we, by the way, printed yesterday, but which we, you know, have not yet confirmed.
So it's a risk, and you know, you can make arguments against it, but anyway, you're looking for any signs here, especially the SMI down, for this bullish intent if you want it to really work, and this, you know, pretty aggressive downtrend that semiconductors have been in for the last week or so , you know, kind of corrected up.
But again , let's move step by step. So we'll continue to monitor this. Uh, AVGO. So, AVGO on the weekly chart, again, the same picture, right? You know, this is a pretty proven level of support for AVGO, pretty good, right? This whole little area here where there was constant buying pressure. Every time he approached this area.
Here we are again . But to me, the overall picture is still, again, from the low here to the high here, still trying to form a massive higher low with the green Fibonacci line in the 320 range. To me , as long as the 320 level is not lost for AVGO, as long as the price is above 320, period, that remains a very bullish signal to me.
Sorry, I dropped my pen. I will be back soon. Em. Yes, I'll bring that up later. But, in any case, you know, this will be the general perspective that I'm going for. So far, the 320 range continues to hold on AVGO. Obviously, we are still a long way from that deeper support range, but in any case, this is a kind of general picture.
A more aggressive “bullish” picture, right? If we want to move sooner rather than later, if we want the asset to really " wake up," again , you wait for that trend line to break. It's the same story every time . Until you see the price on the daily and weekly charts, both ideally trading above this trend line, the stock will continue to fluctuate.
She will continue to do nothing, you know what I mean? It's simple, that's all we're looking for. We want to see the price above this weekly and, of course, daily trend line. That's when he'll most likely start to wake up. The good news is that the SMI is near the bottom of this range . Again , when stocks are fluctuating, an SMI near the lower bound is usually a good sign, not a bad one.
And we have TSM. I won't lie, the backlash here is deeper than I expected. I definitely thought the stock would at least start to slow down in the 350s or high 440s. But they fly past this level. I mean, we have reporting at night, right? It's tonight, so we'll see how it goes. Keep this in mind. And tomorrow we have PPI.
But SMI is quite deeply oversold . This is one of the most oversold levels I have seen in a long time. Almost the same as when we had a significant drop here. So we'll continue to monitor this. Stocks, you know, are the place where latecomers are punished . Let's just say so. Of course, revenue is a huge risk and issue in the short term.
But in my opinion, this is where the latecomers start to get their due. If you're just now becoming a " bear," you're a little late, aren't you? Because the shares are, firstly, slightly oversold relative to the moving averages. SMI is significantly oversold , right? And now we are also entering this important support zone.
We had this breakthrough, right? We had a nice breakthrough on this sort of "pennant" pattern, if you will . Large-scale upward movement. Now we are retesting this area as well. So we'll see how we close. But honestly , when I see such ugly candles at the beginning of the week, it tells me that there are two more full days, especially with the reports and PPI, to turn what looks really bad into a pretty good candle.
Because that's how bullish hammers are formed. You start, you know, the first half of the day or the week, right? Depending on which candle you are looking at, daily or weekly. And then you finish strong. Weak opening, strong closing. Or a weak start to the week, a strong end to the week, right ? That's the difference.
And I look at it in a similar way here. So, you know, we'll see how things go with the reporting. Again , there is always a risk. Nothing is perfect, but if we can get a good push on this name and start closing, you know, at least in the 440+ range, then it could turn what looks like an ugly candlestick into something not so ugly.
But of course, we will continue to monitor this step by step. Now about the risks, right? What are the risks here? You know what we wouldn't want to happen? We definitely don't want to lose this trend line. So, in the Merton video, I don't want to see this trend line disappear. This trend line has been holding this uptrend, a pretty aggressive uptrend, for some time now, right?
Almost from the very bottom of 2025, right? So, more than a year has passed. Losing this trendline will significantly reduce the momentum to the upside, and it could really stop any more aggressive upward movement. But, as long as we stay above it, as is the case with Nvidia, I still favor the bulls without question.
Again, losing this level is where I start to have more doubts, if you will, and I start to seriously question the momentum left in this market. But we are still above support levels, so so far so good. But, of course, it is worth understanding all the risks. Anyway, thanks for watching, guys. See you tomorrow. See you later.


Comments 0