
저자: TheTeslaGuy · 외국인
요약 보기
테슬라가 실적 발표 후 급락해 219달러 부근에서 마감. 100일 이평선 아래로 이탈했고, 주요 지지 210달러(주봉 채널 하단·저항 이탈 후 리테스트) 재테스트 가능성을 제시. 210 부근에서 반등 시 피보나치 0.382(244.5)·0.5(255)·0.618(265) 저항을 목표로 봄. 옵션 흐름은 풋 청산과 콜 진입이 나타나며 약한 낙관 신호가 보이나 여전히 약세 우위로 판단.
다듬은 글
Hello everyone, what's up , and welcome to a new Tesla review video. So, today, as usual, let's talk about Tesla. Let's consider what's happening, because it just completely collapses. Honestly, maybe I wasn't pessimistic enough. Everyone complained that I was too big a bear up here. I guess I wasn't pessimistic enough, because, I won't lie, it's a little weaker than I expected.
But despite everything, let's consider this. If you liked it, don't forget to click the "like" button . This is not financial advice. I am not a financial advisor. And of course, if you want to join my YouTube membership section, $2.99 a month is pretty cheap, in my opinion . You get access to all my thoughts throughout the day as Tesla moves, and my thoughts on it all pretty much live throughout the trading day.
Link below if you're interested. But let's get straight to the point. Tesla closed the day at $218.9. Oh, or rather, the updated price after the market closed—219.23, which is a little less than 3% in the red, despite the market falling almost, you know, about a percent on average. So, unfortunately, another low for Tesla.
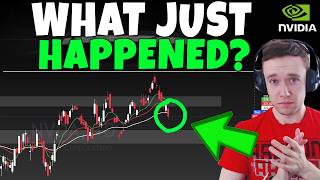
Now let's discuss this, ladies and gentlemen. What is happening with this stock and where is the bottom? So, first on the agenda—the most important thing to discuss, I don't know what it is. Let me actually quickly update the question. The most important thing to discuss on the daily chart is, of course, the 100-day moving average, which of course is this yellow line right here, which we actually got down to this morning.
We actually bounced off of her a few times and it looked pretty good. Honestly, it looked like we could potentially get that rebound, and she was going up, you know, to 225 again, and it looked promising. And then, closer to the last hour or an hour and a half of the trading session, Tesla just kept falling.
As you can see, these red candles are very aggressive selling. Well , not too aggressive, but pretty aggressive selling and just a lot of weakness. And unfortunately, we also closed below the 100-day moving average, which is not a good thing. Now, again, I have this 3 day rule. Just because we closed below it doesn't mean it's over.
I have a 3 day rule. So, basically, if Tesla can't get above this 100-day moving average tomorrow or Monday, maybe, but ideally tomorrow. Okay, maybe that's a little bad. But you know, that would just mean we'd get down to my ultimate goal, or I guess my second goal, which is around 210, right? Which, as I discussed many times yesterday, is easiest to describe on a weekly chart, right?
A weekly schedule is the best way to look at it here. It's just much easier. But, nevertheless, right? Essentially, at level 210 we will observe many things. Three things, three retests in essence. The first retest is the general ascending channel we are in. We're going down to testing at around $210, of course, plus or minus a few dollars, but somewhere in that range.
By the way, MACD looks a little suspicious here. This is not very good. We definitely need to bounce back as soon as possible because the MACD is starting to potentially turn bearish. He almost turned bearish right here, and obviously it didn't happen. And we are in the same situation now. So it's definitely worth being careful, but nevertheless, the first thing is , of course, as I said, the bottom of the canal.
We're essentially testing it , more or less. Or maybe potentially go down to it and see what happens at the 210 level. This is not really a retest. It's more like just a bounce in the channel. But there will be two main retests, of course, the first of which is this blue line, right? Which, of course, is this downward channel that we were in, right?
Which we have been in since the times of historical highs. We were constantly rejected here, here, and here, right? And then we finally broke out of it on this candle. And now again , around 210-205, there will be testing, which is common, of course, when you break out, you test, it's very common. The second thing, of course, is the situation right here, where you can see that it was support here, then resistance here, and now we're coming back after a breakdown.
Same here. Essentially, a retest of what was resistance and has now become support. So that's going to be the most important thing I'm going to pay attention to at around 210. Right? So, that's the first thing, right? This is on a weekly schedule. That's the simplest way to look at it. Isn't that right ?
Again, on the daily chart—the 100- day moving average. We are closing well below it. Of course, we have volume at a price that we are finally entering, you know, with more volume. Again, this is nothing. That's not an extremely large amount, right? This isn't the most insane volume increase, is it? It's about the same as it was here.
So nothing extraordinary, but still it's an increase in volume, which is good. This could be a reason for at least a small rebound. And of course, below that, starting at about 210, which I just talked about, and all the way up to 200, or probably 203-204, there will be a pretty significant increase in volume.
You see, right down here, it's going to be a much more serious increase in volume, and I really think that the rebound...I would be very surprised if we went straight down to 210 from here and didn't get at least some kind of rebound, at least for the rest of August, the second half of the month. It would be really a bit strange if we just continued to fall, broke the 210, 200 level and rolled down to, say, $150 without stopping.
It's not impossible. This would be very strange, unless Elon starts selling again, which, in my opinion, would completely overturn all technical analysis, as it has already done before. But I would be genuinely surprised if it happened without at least some kind of rebound of relief, like a " dead cat bounce ," some ray of hope—that would be strange, wouldn't it?
The RSI is now almost entering the oversold zone, so that is another factor to consider; This is quite important to remember. Now let's talk about what happens if we bounce back, okay? Where will we bounce? This is the main question that I am sure interests people. Okay , let's say 210— just for the sake of example, let's say we hit 210 , and that's the point we're starting from.
The volume is there. There are levels for retesting. Buyers are really getting into the game, and it makes sense. Okay, great. Where are we headed next? What will happen during the rest of August? Assuming, of course, that this is the rebound point. Let's take Fibonacci levels. Let's lay them out from the swing high to the theoretical swing low, which is located at approximately the level of 210.
The main levels, as always, gentlemen, that I will look at are the Fibonacci levels of 0.382 and 0.618. In other words , it's 244.5, around 255, and around 265. These are the three levels I'll be paying attention to and where I think a rebound could take us. Again, 0.5 is my favorite level. I'll be watching it the most, it's around 255, and I think it makes sense that we could get a potential bounce there, maybe in the second half of August or early September, before what I believe will be new challenges.
So, with that in mind, there is a possibility that this could be the bottom. I don't think the probability is too high, but it's not so low that it can be completely ignored. Personally, I would think that, let's say, 210 is a V- shaped bottom from which we would start moving up if we could break through the 0.618 level, which is around 265, maybe up to 270, somewhere in that area.
Assuming, of course, that the bottom is indeed at 210. These levels will change depending on where the bottom actually forms, right? But the 0.618 level, if we can break it after the bounce from the conditional 210, would be a pretty bullish signal to me, and it would mean that this bottom is most likely the real bottom.
Because the bears would have to defend this level to continue the downtrend . Because if we break through 0.618, to me that means this downward trend that we observed after the reporting, and it was quite significant, by the way, right? This was, in fact, a 26% movement at this point . And if we drop to 210, that would be almost a 30% drop after reporting, which is pretty significant, right?
This is not a little, it is truly a lot. A pretty decent correction after such an astronomical movement, which shouldn't be surprising, but I'm a little surprised at how quickly it happened. But that's how it works, isn't it? So, as I said, if we break 0.618, it would mean that the bears did not defend the level they desperately needed to defend, and that this downtrend should, in theory, be over.
This doesn't mean we'll continue to grow rapidly, but it tells me, at least theoretically , that we shouldn't upgrade the minimum. For example, it might look like this , right? Just for clarity, okay? So, let's say we move from here and go down to this general level, and again, assuming that 210 is the bottom, and let's say we break through the 618 level and go up, let's say, all the way to 277 for demonstration.
To me, this means that instead of going down from here, breaking through this level and going even lower , which is still possible, it just reduces the chances. Don't forget that trading and technical analysis are all about probabilities, right? In my opinion, this reduces the chances of something like this happening.
Instead, I would expect something like a decline, maybe to 230, you know, maybe even a little lower, somewhere in the 220 area, and not break that low again, assuming we break the 618 level on a potential rebound. I hope this makes sense, but that's how I personally look at it, of course, right? I could be completely wrong, of course, right?
Keep this in mind . No one is a perfect trader. Nobody has a crystal ball. And if you have it, hey, I would really appreciate it if I could borrow it. But that's pretty much how I look at it. But overall, the RSI, while becoming oversold, still doesn't look ready to reverse. Unfortunately, the stock on the daily chart is not showing any bottom signals yet, which is disappointing.
The MACD on the daily chart is still showing lower lows, which is not good. Overall, the situation still looks bearish. Uh , Bollinger Bands, I wasn't talking about Bollinger Bands. People were looking for or asking about them. We saw it in the comments. And the main reason I hold them is because I know the asset is oversold.
I know he's touching the red line. I just didn't even look at them because he's absolutely touching the red line. But unfortunately, you know, it doesn't matter in this case because it's not showing any signs of bottoming out yet. But once that happens, of course, as always, you know, very often the price returns to the mean, to the white line, which is currently around 250, which is one of the levels that I just talked about in the context of Fibonacci, around the same general level.
So keep that in mind. It's also important to, you know, understand to some extent, if you will . Otherwise, there's not much else to talk about. Ladies and gentlemen, Tesla is not making any obvious steps forward yet. It is not yet showing any clear signs of bottoming out . It seems that the price is still set to decline.
And I think that tomorrow it is quite likely that we will test the 210 level again, or at least the mid-range or lower values in the tenths range. Very, very likely. And I will definitely be keeping a close eye on this. So, yeah, let me know what you think in the comments, ladies and gentlemen. Thank you very much everyone for watching.
If you liked it, don't forget to hit the like button. I think the last thing we'll take a quick look at is, of course, options, right? It is always important to understand the situation with options. And now we're starting to see a little more. However, let's return the premium to the values we usually use.
Let's set it around 50, in the fifties. Yes. So , you see that there are clearly fewer red bubbles, right? Compared to the past few days, it seems like yesterday or the day before yesterday we were looking at this Tesla options flow and it was significantly more bearish. Not only were there more red circles, which essentially means a bearish stance, they were also larger.
There are much fewer of them now. It looks like bears and those who held puts are starting to book profits. And now we see the first green signals appearing. People are starting to open call options. Certain positions are being formed , and people are starting to think that somewhere at this level, maybe a little lower.
You know, we're looking for a base. We are looking for a rebound. So keep that in mind. The first signs of optimism are appearing. Although, in my opinion, the situation is still more bearish than bullish, so perhaps 210 or at least lows in the tenths range are possible as early as tomorrow. But the bulls are starting to show up a little bit with some bullish calls, which is a good sign.
Overall, thank you all so much for watching. If you liked the video, don't forget to like it. This helps a lot. And of course, as always, see you in tomorrow's video. Peace be upon you.

Comments 0