
저자: ChuckCarnevale · 외국인
요약 보기
Oracle, Broadcom(AVGO), NetApp, NXP 4개 성장형 배당주를 FAST Graphs로 분석. 기업별 PER 대비 성장률 기준 적정가치 판단, 배당 커버리지(영업·잉여현금흐름) 점검, 애널리스트 성장 전망 소개. 전반적으로 Oracle은 가치 적정 수준이지만 더 싸게 사고 싶다고 언급, Broadcom은 적정 평가, NetApp과 NXP는 매력적이라고 평가. 과거 실적·밸류에이션 설명 중심이며 단기 가격 방향 예측은 없음.
다듬은 글
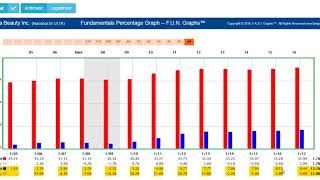
oracle corp is in the information technology sector sub-sector system software as you can see by looking at the long-term fast graphs here the company has been a very consistent double-digit grower growth has averaged over 12.88 percent the company started paying a dividend in may of 2009 and have steadily increased that dividend almost every year since at a much higher rate when you put price on the graph monthly closing stock prices you can see that the stock price generally tends to move in line with the company's operating results and you can see clear times when the stock is undervalued when the price is below the line you can see periods of overvaluation and you can just by looking at a graph like this see how overvaluation can affect your performance you can also see periods of undervaluation which turn out to be the optimum time hello everybody this is chuck carnevale co-founder fast graphs the fundamentals analyzer software tool aka mr valuation and you know i've been writing about a lot of dividend growth stocks here recently because dividend growth stock investing is primarily where my major focus is but one thing that's really i think important about value investing is that value is not just about buying a stock when it's real cheap value is also functionally related to the amount of growth the company can achieve and what i've been really talking about in more recent videos has been slower growing or average growing even higher yielding stocks today i'm going to switch and look at some fast growing stocks in the information technology sector companies that offer double-digit growth of both earnings income and even stock price appreciation and so we're going to look at four that i think you can look at as research candidates and you know i probably would only pick one or two of these if it was me i want to give you some more healthy growth or stock stocks that have been trading at decent valuations for the most part some of them have come down in value as oracle did as i showed in the in the previews here but we're going to go through these here we're going to create a portfolio i've created a portfolio here for you and i've titled this portfolio total return because what you're really focused on here is total return all four of these companies really information technology two of them are semi-conductors one netapp is a technology hardware storage and peripherals company and then oracle is known as a system software company as i originally alluded to so we're going to take a look at all four of these in alphabetical order for you and analyze why i think these stocks would be interesting research candidates that you might want to consider for your current portfolios so let's go ahead and start in alphabetical order with avco now what i also want to do here is i want to show and i want to illustrate because i get a lot of questions from subscribers to fast graphs about this fast graphs is the fundamentals analyzer software tool and as such it is very dynamic and allows you to analyze fundamentals and fundamental growth and everything as i mentioned value investing is also functionally related to growth the faster a company grows the you know higher the rate of return expectation you can expect as long as you buy that stock at a reasonable value that is commensurate with the growth that the company is achieving so growth and value in a way are joined at the hip i'm going to make that clear now when i first look at this graph i see that the company has traded at around 15 times earnings the actual normal pe over this time is 14.78 that's you know rounded to 15.
the growth rate of earnings over this time frame and that's from point a you know to the end point b is averaging over 32 percent but i want you to analyze that when you're looking at a graph or using fast graphs i want you to make sure you're looking at the data the one thing i recommend is always check the graph key here and look for the growth rate and the p e ratio when you have a fast growing stock like this one has achieved then you're using the formula price earnings ratio equals growth rate that was made famous by legendary investor peter lynch so what i've drawn here is an orange line on this graph of a 32.18 p e ratio which is equal to the 32.18 growth but that's not really a realistic p e ratio for this company here you can see the blue line is much more realistic but the reason that that number is so high you've got a 232 percent growth rate in fiscal october of 2010 and then 2011 it was 23 percent growth then it dropped to three four and then we had a 70 year in 2014 so you can see that growth is somewhat you know erratic so the first thing i'm going to do is i'm going to take out or call out the 232 growth rate now we see that the growth rate has shifted to 23.77 so the p e ratio of the orange line on this graph is now 23.77 the blue line is still around that 14 or 15 number it's 14.36 to be precise but you can see there's many times where it traded at above a 15 p e ratio so i'm getting a little better picture of the company i cut a couple of more years off and now my growth has gone back up to 27 but once again that's basically you know averaging some real high growth years with some flat growth years so i'm going to drop this all the way down to seven years and what i've got here now is about a 15 growth rate and again i've got that p e ratio of 15.34 so what i've been able to ascertain so far by looking at the fast graphs and using the dynamic feature and running the different time frames is first of all a 15-ish valuation is a pretty solid valuation it's something you can really hang your hat on when you're looking at valuing this company as far as whether it's a good buy sell or hold growth rate has averaged about 15 percent in the last several years and you know but that again will have a 30 percent year mixed with a 2 year four percent year at twenty six percent year another thirty percent year and so on okay so one thing i'm looking at here but notice how the price has really moved in line with that fifteen growth rate now if i look at performance over this time i get a couple of very interesting things one thing is we see the dividend has grown by over 39 percent and the company's capital appreciation has averaged just about its growth rate 15.96 percent add in the dividend which has been more than the s p 500 paid over the same time frame and you get a outperformance of 18.39 against the market of 11.8 but i also want to make another point this company started paying a dividend in 2011 and they've actually increased that dividend over that time frame if you look at this long-term time frame at over 40 percent a year so growth is a hallmark of these technology companies now as far as forecasting goes analysts are still expecting double-digit 15 plus percent growth over the next couple of years but once again that's 38 for this fiscal year which ends in october and then eight percent and eight percent following the long-term growth rate is expected to be about 17.8 so more of the same if you will remember these numbers are not right because they're forecast and they're not perfect but the idea is are they within a reasonable range and when you're looking at a company like broadcom here symbol avgo you've got a company that can give you double-digit growth and certainly growth of dividends so when you're looking at getting a total return on this company you're looking at getting it from a function of growth plus income you know plus capital appreciation now i don't consider this company excessively cheap at this valuation but i do consider this company reasonably valued here so we don't have a great margin of safety but we do have growth to compensate for that so there's broadcom that's the first one i want to point out now another thing since this is a dividend paying stock i'm going to now look at it from a standpoint of operating cash flows now what i'm interested in here i'm going to take price and the normal pe off the graph because what i'm interested in is the operating cash flow covering the dividend in other words they have plenty of cash flow to cover the dividend and the answer is yes and i will also look at this through the point of view of free cash flow and the company also covers their dividend with free cash loan they have since 2015.
it got pretty close where they had almost 100 payout ratio in 2014 but otherwise their free cash flow has covered their dividend if i look at sales growth in the company sales growth has averaged over 21 i consider that a very attractive growth rate as well so all in all i think broadcom offers a real good interesting look today with a nice almost a three percent dividend yield 2.97 and you know it's got growth potential going forward so if you like healthier growing companies then a company like broadcom or avgo symbol abgo might really fit your bill now this is a very competitive industry that the company's in and you know i think that's worth mentioning and that's worth talking about the company does compete with some of the big firms you know then i think you should obviously be aware of that when you're looking at companies like this or any of these tech sectors but a lot of them compete with each other you know the company faces competition and analog devices from companies like cisco cree marvel nxp which i'll be also talking about and others and then in the infrastructure software market that they also operate in they're competing with the likes of cisco crowds like ibm microsoft salesforce oracle and vmware so there's a lot of competition in the industry for these companies and i think you should be aware that's why i've given you four choices here to look at so the next stock we're going to go to we're going to go down the line in alphabetical order we're going to look at network appliances i like to call it or netapp and i'm going to start you know sales has been averaging double-digit rates so that's good to know i'm going to look at ernie's growth has averaged over 19 percent been a little more cyclical they started paying a dividend in 2014.
grew you know modestly for about three or four years then they increased their payout ratio everything below this white line is the portion of earnings they're paying out to their shareholders so you can see you know this is also offering two point seven seven percent you know over two and three quarter percent yield the company does have good long-term performance from the standpoint of the growth of the dividend has averaged over 19 percent per year growth and it did freeze the dividend in 2021 and had a you know rather modest but there was back in 2019 they did raise their dividend by almost 100 so it doesn't have quite that predictability of some of the you know aristocrats and dividend kings that i showed before but it does offer good income does offer good yield and it does offer growth potential analysts are looking at you know just under 10 percent growth over the next couple of years the long-term growth rate is expected to be about nine percent so again this gives you a good you know shot at earning some decent returns this has a little better evaluation than i saw with avco based on that growth rate so i think you're looking at a little more rate of return potential for this company a slightly better margin of safety and again those are things that i think you should take into consideration when you're looking at the stock these stocks are all you know growthier than what the other ones that i've shown you here in the past once again if i go through the metrics here and look at things like operating cash flow i see their operating cash flow has covered their dividend and then i'll also look at free cash flow these are kind of tests to see how safe the dividend looks to me free cash flows covering the dividend quite well so i think we have a safe dividend here and if we get some decent growth we've got an opportunity for that dividend to increase let's put price on the graph this one from a cash flow point of view is trading at a fair value but from an operating earnings point of view this gives us the best margin of safety historically and looking at it from a forecasting point of view again it has a minimum amount of safety and about a 10 percent growth rate so network appliance looks attractive to me at these levels with almost a three percent yield the next stock we're going to look at is nxp semi conductors this company is you know been growing at a rate of almost 20 percent a year long term they did have kind of a down year during covid you can see how again the price tends to move where the earnings go it's significantly undervalued today on a historical basis looking at forecasting expectations are for 13 growth going forward the longer term growth rate is expected to be about double digit again about 12 so again the key factor here is that we have growth potential if i look at the performance of this company since 2010 you can see that they've outperformed the stock market as measured by the s p 500 by quite a bit they've only been paying a dividend since 2018.
i want to point that out but if i look at their dividend already it's almost mirroring the essence it's almost matching i should say the s p 500 and yet they've only been paying it for a short while for about five years over time so we've got good dividend growth the yield is just under two percent one point eight three percent and i think we've got potential for long-term growth once again when i go through and look at operating cash flows cash flows are really strongly covering the dividend and if i look at free cash flow free cash flow is also you know covering the dividend like a blanket so these are a little better growing companies i don't use valuation with free cash flow i want to keep that in mind you know the company sales growth has averaged about nine percent a year trading a little bit at a premium to price the sales but nevertheless i think nxp semiconductors is worth a look at these prices now oracle is the company i opened with and i featured in the beginning what i like about oracle was probably the most established here the company has you know started paying the dividend since 2009.
you can see it was really significantly overvalued coming into 2022 in october of 2021 it was really trading at a peak value the stock corrected it's maybe a tad pricey now the growth rates averaged almost 13 a year forecast growth is about 11 for the next couple of years long-term growth is kind of more of the same 13 or 14 percent that would make this a very attractive long-term hold i would like to get this one a little cheaper i'm actually long this stock and i do own it i've owned it for several years so i'm in you know really good position on this company right now and you know i feel real good about it as a long-term investment again these stocks are very competitive when i look at it from a standpoint of its operating cash flow again the dividend they did have kind of a bad year cash flow wise but that's still well covering the dividend for an operating cash flow free cash flow has gotten a little closer but it's expected to recover strongly so i do think the dividend is safe here it's a triple b plus rated company so i like oracle i would like to get oracle a little cheaper i just want to make that point but i think oracle is certainly in value now you could buy it today but i'd like to get it when it was a little cheaper so you know the point of this the real story here that i want to basically focus on is that you're looking at growth here more than i have been in some of the stocks i've shown you recently which have you know modest five or six percent growth even lower growth rates than that these companies have double-digit growth potential they have pretty good dividend yields for considering the growth aspect of the companies most of them are pretty healthy at this stage so i think these are all stocks that you can conduct some good research on if you're looking for total return in your portfolio i think there are selections here that might fit your needs anyway this has been chuck carteville co-founder fast grass the fundamentals analyzer software tool saying thank you for watching the video again if you like this video give me a like ring the bell subscribe to the youtube channel and also you might take a look at subscribing to fastgrass it's got it's a very powerful tool and i've been using the new version of the tool which by the way for those of you who are already subscribers we plan to be launching that possibly as early as by wednesday of next week is what our target date is for right now and you know we're testing it making sure there's no bugs if we come up and that might delay that but right now it looks like we're on track to do that thanks for watching and talk to you guys soon in the next upcoming videos i'm going to continue looking for growthier situations in other sectors so i'm looking for dividend growth stocks that give you the opportunity to get a little growth in your portfolio at the same time thanks for watching you


Comments 0