저자: 미상 · 외국인
요약 보기
빌 애크먼의 포트폴리오 상위 7개 종목(CMG, HLT, QSR, GOOG, HHH, CP 등)을 재무지표 기준으로 분석하는 교육용 영상. 칩otle은 현금흐름 성장과 재무 건전성이 양호하다고 평가, 구글은 높은 ROIC와 낮은 부채비율을 강조. HHH는 ROIC 적자로 주의 필요, CP는 ROIC 하락 추세를 지적. 1~3개월 가격 방향에 대한 예측 발언은 없음.
다듬은 글
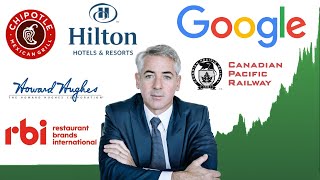
in my opinion one of the most interesting investors to keep up with is Bill Amman Amman is the founder and CEO of parishing square Capital Management and has a mass a net worth of over $9 billion I've personally learned a lot from listening to his investment philosophy which he describes in this clip so we look for very high quality businesses uh what we describe as simple predictable free cash flow generative dominant businesses a business that Warren Buffet would describe as having a mode around it so in this video we're going to be analyzing all seven Holdings in his portfolio and to do this we'll be using my ticker data powered spreadsheets which you can download on ticker dat.com at the link in the description now let's go ahead and jump in now the first and largest holding in Bill amman's portfolio is stock ticker CMG and this stands for Chipotle Mexican Grill and you can see all this data is going to automatically load in thanks to the help of the ticker data add-on now this position is over 20% of his current portfolio and the company actually just had a 50 for one stock split making the current share price sitting at $552 9 cents per share if we jump over to Seeking Alpha we can see over the past year they've actually done really good up nearly 30% but if we actually look at them in the past month alone down by about 17.38% so that's a pretty big jump down now in the past 5 years this company has performed very very well up nearly 280% and if we go ahead and jump over to our stock screener sheet let's come up here plug in CMG and hit enter and we can see all this data is going to automatically load in now immediately we can see quite a few things that we like first off revenue for share has exploded over the past decade going from about $28 to in 2023 all the way up to $717 and like Bill acman stated earlier in that short clip we saw we can see free cash flow has been predictable and it has been growing especially over the past few years at a pretty high rate in 2020 free cash per share a little bit lower than it had been the previous years but it was sitting at about 21 cents per share but in 2023 it jumped all the way up to 89 cents per share so that's a pretty big jump during that short time period and earnings share has followed as well with staggering growth we can see the company has been buying back some shares over the past decade and if we jump over to the profitability spreadsheet one of the things we can also see is double- digigit revenue growth over the past 5 and 10 years and double digit net income kager over the past 5 and 10 years as well but what's really interesting is if we look at the gross profit ratio we can see some serious increases since 2016 now before 2016 it looks like it was hovering around 26 or even 27% and it dropped all the way down to about 12.76% in 2016 but since then we've seen it recover pretty quickly and in 2023 gross profit ratio was sitting at about 26.2% now if we jump over to the dividend breakdown sheet come up here plugin CMG now what we can see is a lot of this data is not going to load in because this company actually doesn't pay a dividend but this gives us some interesting insights and perspective into what the main focuses are for this company right now so keep in mind there's five different things a company can do with free cash flow they can reinvest it back into the business pay out dividends buy back shares they can pay down debt or attempt mergers and Acquisitions and it looks like the main focus for this company right now is reinvesting back into the business and this is probably one of the reasons they've had so much free cash flow growth over the past decade among other reasons but when we look at the free cash flow growth over the past 10 years we can see in 2023 they had about 1.2 billion in free cash flow and in 2013 it was sitting at about 328 million so pretty phenomenal growth that's a 14% free cash flow kager and finally if we go over to the balance sheet breakdown plugin CMG now when I look at the balance sheet one of the two main things that I focus on are the current ratio and the debt to assets ratio and what the current ratio tells us is how easily a company can meet their short-term debt obligations and basically what this is it just takes the total current assets and divides it by total current liabilities and we can see in the case of Chipotle at the end of 2023 total current assets sitting at about 1.6 billion while total current liabilities sitting a little over 1 billion so that put their current ratio at about 1.57 so typically we want to see this number above one or above 1.2 and they are above that threshold so it looks like they're in pretty good shapee and the debt to assets ratio this is just total debt divided by total assets sitting close to around 50% and it consistently has since it looks like 2019 so it looks like it's in a healthy range and we like the consistency now with all this being said we can actually see Bill Atman has been reducing this position for the last few quarters we can see in q1 of 2024 he reduced his Chipotle position by about 99.82% and in Q4 of 2023 he reduced his position by about 13.49% why is this well he was actually actually asked and this was what he stated what started out as a large position recently became a massive one in excess of 20% of capital we sold stock earlier this week only for portfolio management reasons now keep in mind this quote was from 2020 so it is possible his thesis has changed but still there is no doubt he's been greatly rewarded from holding this position now the second largest holding in his portfolio is an interesting one and it's one that I've never covered on the channel before but we can see that stock ticker HLT Hilton worldwide Holdings and this makes up about 18.2% of his current portfolio if we go ahead and jump over to Seeking Alpha we can see over the past year it's done really really well up by about 47.
51% and if we look at them in the past 5 years up by about 120% if we go ahead and jump over to our stock screener click down here come up here plug in HLT and the data will load in now unlike chipot we can see they actually do pay a small dividend starting dividend yield sitting at about 0.27% but it is a very low payout ratio now we can see free cash flow per share 2020 and 20 21 it took a pretty big dive down and we can see this was reflected in the share price the company was trading as low as about $56 per share but we can see in 2022 and 2023 free cash flow per share recovered and it actually reached all-time highs in 2023 at $6.48 per share and they actually saw pretty good levels of return on invested capital in 2022 and 2023 as well sitting at about 19.5% that's a sign of a highquality company typically we like to see a little bit more consistency but over the past few years roic has has definitely been pretty solid now if we jump over to the profitability sheet come up here plug in HLT and one of the things we can see on the profitability spreadsheet first off earnings per share was down negative in 2020 negative -2.6 and the gross profit ratio was down pretty significantly and it looks like Bill Amman actually took advantage of this if we scroll all the way down we can see in q1 of 2020 Bill Amman was buying a lot of stocks and one of those was Hilton worldwide Holdings HLT he added a pretty significant stake to his portfolio so he definitely took advantage WEP over to the dividend sheet plugin HLT we can see the company has paid a dividend and it is currently paying a dividend with a yield at 0.27% but it's pretty insignificant overall and we can see there's not a lot of consistency with those dividend payments the third largest position in Bill amman's portfolio makes up 17.24% and that is qsr and that is restaurant Brands International like I said allocation at 17.24% and we can see this company actually has a decent starting dividend yield sing at about 3.1% and if we jump over to Seeking Alpha over the past year it's been pretty flat down by about 3.25% and over the past 5 years again pretty flat up about 2.79% now if you aren't familiar with this company if I scroll down this is basically a company that owns a few different restaurant Brands we can see companies like Burger King popey's Firehouse Subs and if we go ahead and jump over to stock screener we'll come up here plug in qsr and hit enter and we can see Revenue per share has kind of been all over the place over the past decade but definitely quite a bit higher than it was back in 2013 2023 Revenue per share sitting at about $23 EPS in 2023 sitting at about $ 388 now we can see the free cash flow yield for this company is decent sitting at about 5.24% now what does this mean well free cash flow yield is simply our free cash flow per share divided by the current share price of the company so basically it's letting us know as an investor when we buy one single share in the stock how much free cash flow are we getting for that single purchase and our free cash flow yield is telling us to be about 5.24% so it's kind of a valuation metric that's somewhat decent we jump over to the dividend breakdown sheet we can come up here plug in qsr and we can see all this data will automatically load in now the starting dividend yeld for this company is sitting at about 3.1% but we can see this company is using the majority of their free cash flow to pay out dividends like I said a company can use their free cash flow in five different ways and one of those ways is paying out dividends so the free cash flow payout ratio sitting about 81% doesn't leave a lot of capital left over to reinvest back into the business or do things like pay down debt or even buy back shares now we can see the free cash flow has been covering the dividend payment for the entirety of the past decade but the free cash flow payout ratio has continued to climb higher and higher so not necessarily a good sign for the company 10e free cash kagro has been very good cuz like we saw Revenue per share has increased pretty dramatically over the past decade but the past 5 years free cash flow growth has been pretty slow now the fourth largest position is actually also the seventh largest position and I'll explain what I mean by that and that is Google now it's also the seventh largest position accepted stock ticker go now what's the difference in go and G well really the main difference is just going to be the Voting Rights gol is going to be Class A shares while go is Class C shares so these shares actually give Bill Amman voting rights within the company but we can see he has 13.27% in ticker goog and about 6.11% in gol so same company just different types of shares but if we go ahead and jump over to Seeking Alpha we can see over the past year Google's actually done really well they're up about 46% and like we already know the past decade has been pretty phenomenal for them up by about 537 per.
now we're all familiar with Google but how exactly do they bring in their revenue well if you're not familiar we can get a pretty good overview here of Google's revenue breakdown for 2023 if we go ahead and zoom in we can see ads make up the vast majority of Google's revenue and this is coming from Google search and other properties but then we have YouTube ads this is another big segment for the business about 31.5 one billion which makes up about 10% of the entire revenue for this company they then also have Google Network ads about 10% we have Google subscriptions platforms and devices about 11% but then we also have Google cloud at about 10.8% so these four Revenue segments are pretty well Diversified and all sitting about 10 or 11% but then we have ads on Google Search and other properties the vast majority sitting at about 57% so if we go ahead and jump over to our breakdown sheet come up here let's plug in go and hit enter and the data we can see here is actually a thing of beauty look how good this Revenue per share chart looks we can see very steady increases year-over-year and over the past decade it's been pretty phenomenal going from about $449 per share all the way up in 2023 to $24.35 and we can see the earnings per share and free cash flow per share for this company have followed as well and they have very low debt to assets ratio which we can touch on here in just a little bit but look at this obviously these three signs are sign kind of a very healthy company but they also have very consistent high levels of return on invested Capital now return on invested Capital helps us understand how profitable are the projects that the company is investing to so we can see in 2021 23.5 in 2022 22% and in 2023 23.2 7% and as a general rule I typically like to see this above 10% so when we start getting in that 20% range that's a sign of a really high quality company in my opinion so there's a lot to like here and if we jump over to the profitability sheet we can see something else that points to them being a very high quality company their gross profit ratio is high and very consistent we can see that 10year average gross profit ratio sitting at about 57.7 1% and the gross profit ratio in 2023 sitting at 56.63 per.
again another great sign for this company now they don't have a dividend history but the company did just recently announce their very first dividend payment now the starting dividend yield after this 80 cent dividend payment is still very low it's sitting at about 0.44% but obviously they have the ability to really increase this at a very high rate moving forward because the free cash flow growth has been so high but finally something that's interesting about Google if we look at the balance sheet for this company I think again you're going to like what you see like I touched on earlier we can see the current ratio seeing at 2.1 so this is way above one so they can easily meet any short-term obligations and the debt to assets ratio is very low sitting at just 7% so total assets about 403 billion while total debt just 28.5 billion so this company's absolutely dring in cash that's a pretty good problem to have and so keep in mind a company that has tons of cash on their balance sheet plus they typically have pretty high levels of return on invested Capital that's a really good combination I think we'll see a lot more growth coming from Google in the future the fifth holding in Bill Aman's portfolio is stock ticker HHH and that stands for Howard Hughes Holdings we can see this makes up about 12.72-ounce much they're down by about 12.4% and if you look at them in the past 5 years alone down by about 43.83090 cash flow per share and there hasn't been a lot of Revenue per share growth either we can see they don't currently pay out a dividend and return on invested Capital has really never been too good and in fact in 2023 it was pretty bad sitting at - 4.67% if we look at the profitability sheet we can see gross profit ratio has been increasing ever since 2020 the 10year gross profit ratio average sitting about 36.4 while gross profit ratio in 2023 was sitting about 42.3 so this is definitely an interesting position for Bill Amman I'm going to be watching this one pretty closely cuz I'm pretty curious to see exactly how this plays out and then finally the last holding in his portfolio that we're going to look at is one that makes up about 12.37% of his entire portfolio and that is stock ticker CP Canadian Pacific Railway limited and this company actually operates in the industrial sector if we jump over to Seeking Alpha we can see over the past year they're up by about 5.19% if we look at them over the past decade up about 115% so nothing really too crazy from that standpoint if we go ahead and jump over to our stock screener come up here plug in CP and hit enter and this data will load in now the performance over the past decade hasn't been super impressive but here's what I do like to see we can see consistent stable and predictable growth from revenue free cash flow and earnings per share this is one of the things that he talked about in that short clip that we saw and I agree I pretty much like what I see right here and for the most part we can see return on invested Capital has been above 10% for the majority of the past decade but ever since 20120 it's actually dropped quite a bit lower we can see 2021 4.68 2022 6.95 and in 2023 8.76 so that's definitely something that they're going to have to figure out now during this time we can also see the debt to assets ratio has decreased pretty significantly going from all the way 45.6 1% all the way down to about 28.58 per.
so it looks like the balance sheet is getting cleaned up a little bit we go ahead and jump over to the profitability sheet come up here and plug in CP now we can see the 5year revenue kager pretty good 11.41 and the 10 year pretty good at 7.43 and the five and 10 year net income kers both above 15 or even 16% so that's pretty solid but what really surprises me about this company is how solid the gross profit ratio is for a company that operates in the industrial sector we can see in 2023 this was sitting at about 50.78 per.
now I didn't mention this on the stock screener page but this company actually does pay a dividend so if we jump over to our dividend breakdown sheet plugin CP so the starting dividend yield for this company pretty low sitting at about 0.66% but we can see the payout ratios are relatively low as well the 10year dividend C is pretty good sitting at about 8% but over the past 5 years they really haven't increased dividend payments that much sitting at about 3% but the good news is the dividend payments are backed by the free cash flow now the free cash flow pay ratio over time a little bit choppy but we can see it's been in a healthy range for the majority of the past decade it's pretty much always sat below 40% with the exception of 2023 when it's gotten up to about 43% and like always if you'd like to be able to download any of my automated spreadsheets and also get access to the ticker data add on in Google Sheets that allows you to automatically import stock Financial straight into your spreadsheet then you can head over to Ticker dat.com at the link in the description so with all that being said thank you guys so much for watching and please don't forget to like And subscribe to the channel


Comments 0