
저자: TwoStupidGuysTradeStocks · 외국인
요약 보기
결론: 마이클 배리의 트윗을 근거로 S&P500이 2000~2001년 닷컴 붕괴와 유사한 패턴을 따를 수 있다는 해석이며, 출연자들은 대폭락 가능성을 제시하되 현재 반등 구간과 10월 단기 바닥 가능성도 언급함. 차트 비교 주장: 배리가 제시한 2000년 9월 이후 하락·반등 패턴(-14%, +10%, -18%, +10%, -29~30%)이 2022년 현재 차트(-12%, +9%, -13%, 이후 추가 하락)와 유사하다고 봄. 두 차트 모두 약 7개월 구간에서 하락률을 측정했으며 2022년 구간 하락률은 약 24.5%로 계산됨. 향후 시나리오: 배리 트윗의 '+22%' 반등 구간이 현재 국면과 맞물린다고 보고, 그 이후 가파른 하락(절벽)이 올 수 있다고 언급. 다만 이번 하락폭이 아직 크지 않아 그 정도까지는 아닐 것이라는 견해도 있음. 단기 전망: 출연자들은 10월이 단기 바닥 또는 반등 시점일 수 있다고 봄. 10월은 역사적으로 주식시장에 나쁜 달이라는 언급 포함. 반등 해석: 최근 점진적 회복이 진행 중이나 거래량이 부족하고 신고점 재돌파는 어렵다는 견해. 기타 언급: 캐시 우드(ARK) 펀드가 75% 하락 이후에도 추가 하락 여지가 있다고 언급. 마이크로스트래티지의 비트코인 레버리지 베팅과 회계 정정 이슈가 버블 해소의 촉매가 될 수 있다는 관측. 출연자 포지션: 한 출연자가 SPY와 QQQ 풋옵션을 보유 중이며 만기를 13개월에서 24개월로 늘리고 각 두 계약씩 추가 매수할 계획이라고 밝힘. 리스크: 차트 구간 설정과 계산 방식에 따라 결과가 달라질 수 있어 해석이 주관적이며, 트윗 해석 자체가 불확실함.
다듬은 글
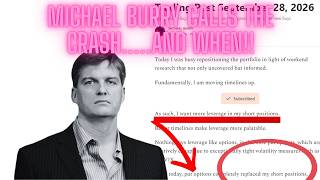
hey welcome back to two surprise trade look at burri's best tweet in the last year comparing the 2000 2001 stock crisis to now and how it is incredibly similar to see what's gonna happen the future yeah i look forward to hearing about it if you guys enjoy this kind of entertaining stock market contact with two super guys trading stocks by means give us like subscribe below we'd love to have you along in this little venture of ours with that we'll get to it i think that a little chart in our intro is exactly what the spy did at that point in time yeah this is rough also this video was a pain in the ass and you're gonna see why so let's get to it here um this is his tweet right these graphs are so smushed together you can't even see what's happening but he's saying s p 500 is it 2001 or 2022.
right exactly he's talking about like all these fake rallies basically along the way down before like the big drop is what i think he's hinting at here exactly now trying to correlate this with what happened and in the somewhere in the two years was a nightmare uh this graph is going to be kind of iffy just stick with me here all right this seems like a lot let me uh shrink your face here and my face all right so if you look at the top right corner here there you go top right corner you can see that from the peak we dropped twelve percent up nine percent and then we uh dropped again up another 13 and down so if you stretch this out to make this way more legible because his is frankly a nightmare because he tried to fit in on tweet all right yeah our 12 drop is coming down to this peak going up the nine percent down to this peak up to 13 and down to here now look at the time all right this is from december to june yeah this is about seven months because it's a little bit of change in december all right now i this percentage this negative 45 0.9 it's a different calculation it's based on different things it's much harder to match but even if you use the high the low or the close of the candles you get within a very very close percentage of this 24.5 so and just to clarify this is the 2022 graph currently yes you got it correct i should have said that yes this is a 2022 graph ready yeah all right so that last thing was over about six six months and change so this was not fun because this is two years of a graph that was trying to find the exact place that he started to do these measurements but i found it it is september 2000 from the peak we drop 14 percent here all right come up 10 drop 18 from the top come up 10 drop 29 30 which is exactly what happens here 14 10 9 30.
now here's the best part okay what's this 22 this little thing that was cut off you know i'm not sure honestly well what is that well this is like i said over a course of seven months you want to see something terrifying yes i want to see terrifying things so this is what berry used he was comparing how similar these instances are and this is our future oh boy when you zoom back out even further on wow zoom out get some more context that whole formula and percentages were based on this all right that plus 22 matches perfectly with this number right here from this bounce that would be the current phase that we're in then right because we've been on an upper trajectory for the last month or so here are we regaining that 22 before we we head off towards this this pretty steep decline here and cliff yes however i don't think it's going to be that much because we haven't dropped as much in the first place and also we're going to do a video showing what we call a dead cat bounce um i don't know why they call it that uh it's not going to make it that high but you can see it's quite a feeble attempt and then just a leak legally yeah death so bad and then a whole year look at the look at the months this is this is september all right 2001 all the way to the next low let's see we didn't break this point till july 2002.
we we had what 10 months of just floating before we set another low wow right you know what it's interesting too with the way the timeline here lines up for me a couple of things one uh i've been saying i think october will be when we see like a short-term bounce or bottom here like a much more substantial which kind of lines up with the timeline of this i would agree and you know historically october is a really bad month for the stock market um the other thing that's funny too is uh we did that video about kathy was there a 75 decline we can link that above uh but during the same time period seeing tracker performance she still has more room to go down yeah that she's looking like my fubo stock essentially her entire fund um one thing here i cut this off to make this more palatable because if you zoom even out another year it turns into a nightmare you can't even like see colors here but this is the probably the perfect example of a double bottom because it just goes leaky just not leaky it just slowly goes up for like the next two years and we just kind of recover yeah the other thing that's funny too is like uh i don't know if you know this but there's a whole story about micro strategy and how they had to restate their earnings and that was what triggered like the birthday of the dot-com bubble some people give them like credit for that um and now you know they have this massive leverage bet against the bitcoin which has been down significantly so like i'm curious what sort of effect they'll have upon them and the funny bookend if they can also help trigger this this unwinding of a bubble i i think we're fairly triggered already i i think what's about to happen we're having a gradual recovery i it's not as much volume as you'd want i don't even think we're going to set another high see our next video we're going to look at the dead cat bounce but this is more motivation for me to just buy i have a spy and a q put right now it was only 13 months i'm going to lengthen it to 24 months i'm going to buy two more of each wow going heavy yeah yeah that's uh that's a bold move i mean i i appreciate though definitely uh smash the like button for the effort that dylan had to put in to try to find the timeline to match up with these charts i doubt anyone else on youtube is doing that so i appreciate the work also on top of that because i'm a perfectionist i had to calculate with the lows from each candle and then the highs and then the and then the clothes because i just want to make sure i wasn't wrong complete overkill and a complete waste of time because it was very clear right the first time i love it i'll see you guys later yeah catch the next one




Comments 0