저자: 미상 · 외국인
요약 보기
결론: 피터 린치식 가치·성장 혼합 전략으로 저평가된 우량 성장주를 스크리닝하고 장기 보유하라는 교육 영상이며, 특정 종목이나 자산의 가격 방향은 언급하지 않는다. 전략 개요: 린치는 기본적 분석 기반의 장기 매수보유 전략을 강조하며, 적정 밸류에이션의 성장 기업을 찾는다. 단기 기술적 분석과 시장 타이밍은 배제한다. 성과 근거: 린치가 Magellan 펀드를 운용하며 1977~1990년 연평균 29% 이상 수익을 냈고, 이는 S&P500 평균의 두 배라고 언급한다. 종목 발굴: 일상에서 쓰는 제품·서비스에서 아이디어를 얻고, 월가에서 덜 주목받는 기업을 찾으라고 한다. 발견 후에는 반드시 사업 내용을 직접 조사해야 한다. 장기 관점: 1~2년 단위 가격 예측은 불가능하지만 10~20년 단위로는 예측 가능성이 높아지며, 10~30개 분산 포트폴리오를 권장한다. 스크리닝 조건: 5년 EPS 성장률 15~30%, PEG 1 이하, 부채/자본 0.6 이하(린치는 0.25 선호), 유동비율 1 이상, ROE 15% 이상, 일평균 거래량 10만주 이상. 추가 지표: 기관 보유 비중 낮음, 내부자 매수, 자사주 매입, 잉여현금흐름(FCF) 중시. 피오트로스키 F-점수와 투하자본수익률(ROIC)도 필터로 제시한다. 리스크·조건: 고성장은 지속 불가능할 수 있어 성장 지속 가능성을 분석해야 하며, 필터 결과는 조사 목록일 뿐 매수 추천이 아니다. 출연자 전망: 특정 자산에 대한 가격 전망 발언 없음.
다듬은 글
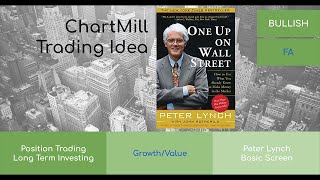
in his book one up on Wall Street Peter Lynch an American investor and fund manager describes the rules of his investment strategy which we will discuss in more detail in this video the investment strategy of Lynch is based on fundamental analysis and is a long-term Buy and Hold strategy it focuses on finding growing companies with reasonable to low valuation so although it has some factors of growth investing it leans more towards a value investing approach pure growth investment strategies often have a technical analysis and Market timing component Lynch does not take advantage of this he recommends leaving Market volatility aside and focusing purely on building a long-term Diversified portfolio that takes into account primarily valuation profitability and the overall Financial Health of a company companies are allowed to grow but only at a pace that can be sustained over the longer term he excludes companies that grow too fast and does it work well it certainly worked for him as the manager of the magalon fund Lynch managed to achieve an average yearly return of more than 29 percent in the period 1977-1990 doubling the average return of the s p 500.
according to Lynch many good investment ideas can come from things you use like or Buy in your everyday life the company does not need to be active in the next hot or growing thing but just has to provide goods or services which are appreciated in their specific field companies can perfectly be involved in relatively dull areas in fact often the mobile and understandable the better often as a retail investor you can use your first hand experience to your advantage companies which have not been discovered by Wall Street yet and will often have low analyst coverage and institutional ownership can often be very interesting so when you notice a specific product service or item turning up more and more always check out the company which creates it the next step is to dig into the company long-term investors cannot run the stock screener and just buy the companies that come out before actually buying you need to do your homework and make sure you understand the business of the company so the screening will just give you a list of companies to research after buying shares in the company the next step is patience Lynch stated that you cannot make any sensible prediction on the price of the company or the market in the next one or two years but over 10 or 20 years the price is more predictable a portfolio of 10 to 30 well selected and diversified stocks should perform well throughout 10 to 20 years the Peter Lynx screen is available in our trading ideas section in this part of the video I will go over the rules of the screen manually solid earnings per share growth indicates greater value because investors are willing to pay more if they believe the company has higher profits relative to the prevailing stock price the ratio indicates how much money a company makes for each share of its stock and is a widely used metric for estimating corporate value earnings per share is calculated by dividing a company's net income by the number of common shares the company has outstanding in chart Mill go to the stock screener page and select the growth tab use the item EPS growth five years and change it to minimum 15 and maximum 30 percent higher growth rates are not sustainable in the longer term in your further research it will be important to understand how the company achieved this growth and you will also need to assess whether the same kind of growth can be maintained in the future annual and quarter reports of the particular company are the main sources of information to get a good idea on this matter the next filter used is the price to earnings growth ratio this ratio uses the price to earnings ratio but adds expected earnings growth to the calculation to arrive at a more accurate assessment of a company's value after all companies whose revenues earnings and cash flow are assumed to grow at a sufficiently high rate are more attractive and valuable than those with only limited growth opportunities formula behind this ratio is simple you divide the price to earnings ratio by the company's expected growth rate a number less than one is an indication that a company in question is undervalued if the result is higher there is a chance that it is overvalued Peter Lynch himself states that the price to earnings expectation and the expected growth should ideally be balanced again we use a five-year average with a maximum of one select the valuation tab in the stock screener and set the pack past five years to at most one the next filter is adept to equity ratio this ratio allows to understand how solvent the company is in the long run shows the relationship between equity and debt thus providing insight into the company's capital structure total depth is measured against total equity raising external capital is not negative in itself but it is important that the depth remains manageable for the company if depth is much greater than Equity then the company has high debt and a capital structure that is riskier for those investing in it in the screener adjust the depth to equity filter through the health tab change the value to at most 0.6 this ensures that the company is funded mobile Equity than debt Lynch would tighten this even a little further preferring adapt to equity ratio below 0.25 combined with the other filters however we use 0.6 as the upper limit and you can still change this afterwards if desired the current ratio is just like the depth to equity ratio another liquidity ratio used by Peter Lynch this ratio shows the extent to which the company is able to pay its current liabilities at maximum 12 months with the current assets on the balance sheet to calculate the ratio a company's current assets such as cash and inventories are set against current liabilities such as wages payable and taxes a ratio lower than 1.0 indicates that the company's liabilities due within a year or less are greater than its assets cash or other short-term assets expected to be converted to cash within a year or less to avoid this the current ratio is set at a minimum of one you'll find that the current ratio under the health tab set the slider to minimum 1.
return on Equity is set as the last specific filter this ratio is calculated by dividing net income by Equity it is a commonly used metric to measure a company's profitability as well as how efficiently it is done the higher the return on Equity the better management succeeds in generating revenue and growth through Equity financing what percentage is used as a minimum depends greatly on the sector to which the company belongs in this screen under the profitability tab a standard minimum of 15 percent is used which in itself is quite a strict selection be sure to compare this ratio with competitors in the same sector to get a good estimate finally we also set a minimum daily volume of 100 000 shares using the general tab we do so to ensure sufficient liquidity You could argue that this is less important in a strategy focused on the long term we therefore suggest checking the results both with and without this filter that way you can be sure you won't miss any interesting companies there are a number of other characteristics that Peter Lynch cites in his book but which are outside the core of these basic filters we have not added those as screening folders but you can check them through the profile page of the company in question institutional ownership according to Lynch the best bargains can be found in companies that are barely being followed by analysts or where institutional shareholders do not yet own a significant portion of the stock Insider purchases directors buying shares of the company themselves is a sign of confidence in the company's prospects and thus a positive sign both Insider purchases and percentage of the stock held by institutionals can be checked via the company's profile page using the ownership tab buying back on shares Lynch prefers companies that buy back their own shares after all most companies do so only when they are convinced that the current value of the stock is a lot lower than its intrinsic value cash is King free cash flow allows companies to pay dividends buy back their own shares or make Acquisitions it is undoubtedly a hugely important indicator and companies with enough cash on their balance sheet are much better armed when the economy slows down and perhaps the biggest advantage of free cash flow is that it is much harder to manipulate than earnings you can access information on stock BuyBacks as free cash flow through the financials menu select the cash flow tab where you can find more details and even more detailed information can be found in the quarterly and annual results released by the companies themselves to view the results you can proceed in several ways and to do so click on the inverted triangle in the horizontal blue bar and make a selection there are many predefined views available if you want a quick overview with charts you can choose charts or two charts with two charts you get by default two charts of the same stock side by side which you can set separately in terms of time frame indicators and overlays if you want to focus more on specific growth or value parameters you can choose one of the different column views such as growth or value through the custom option you can create fully personalized tables and columns as I already mentioned earlier in the video it is recommended to compare companies from the same sector to do this choose the general Tab and select the desired sector for example Industrials now you will only get to see the stocks from that specific sector then you can apply a trend filter for example select the technical analysis indicators section and via the Chartwell Trend tab select long term Trend positive chart Mill shows only the stocks that meet this filter the number of results changes at the same time as you set the filter in addition the website article also lists the filtering options based on the pietroski f-score as well as the return on invested capital the pietroski f-score was developed by Professor Joseph piotroski and it is primarily used for Value investing the score is based entirely on fundamental analysis and it reflects fundamental Health based on the rating between 0 and 9.
the higher the score the better you can set it as a filter through the health tab below I add a direct link to an article that explains more about this f-score return on invested Capital reflects how efficiently capital is used to generate profits it is an important ratio for Quality investors but also for those more focused on value investing this is a very interesting ratio that offers a number of advantages over the classic return on assets or return on equity you can read more about it in our documentation section A Link can be found Below in the description of this video the return on invested Capital filter and two more variants are available through the profitability tab finally companies from this basic list that you want to investigate further can be quickly moved to a separate watch list you do so by clicking on the plus sign then select an already created watch list or you create a new one by clicking on create new at the bottom of the drop down menu so that concludes this video on the Peter Lynch method for screening stocks in Chartwell if you have any more questions please leave them in the comment sections below this video and finally we would greatly appreciate it if you give this video a thumbs up and subscribe to our channel that will help us tremendously to create more similar content so far thanks for watching and we'll see you soon in the next video

Comments 0