저자: JohnHowell · 외국인
요약 보기
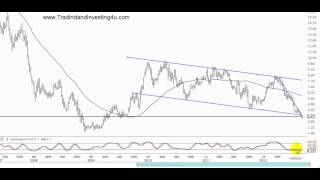
이 영상은 AMD(NYSE 상장) 주가를 주봉·일봉·60분봉으로 분석하며, 현재 $3.47 부근에서 여러 지지선이 겹쳐 단기 반등 가능성이 있다고 보는 기술적 분석 영상이다. [분석 배경 및 면책] 진행자는 일반적인 조언일 뿐 개인 상황을 알지 못하며, 트레이딩은 매우 위험해 손실이 클 수 있으니 충분히 공부한 뒤 투자하라고 강조한다. [주봉 분석] 2006~2007년 이후 장기 하락 채널 안에서 움직이고 있으며, 현재 가격은 두 개 이상의 대형 지지선이 겹치는 구간에 있다고 설명한다. 스토캐스틱이 바닥권에 과매도 상태로 눌려 있어 주간 추세 반전 가능성을 시사한다고 본다. [최근 12개월 추세] 최근 12개월 고점을 잇는 추세선을 그었을 때 가장 많이 닿은 선이 유의미하며, 해당 추세선 아래에서 지지가 반복되는 모습이라고 설명한다. 현재 가격은 여러 지지 라인이 모이는 위치라고 본다. [일봉 분석] 일봉에서도 하락 흐름이 유지되고 있으나 스토캐스틱이 과매도권에 머물러 있어 전환 가능성이 거론된다. 이동평균선 대비 가격이 크게 낮은 위치라는 점도 반등 자석 효과로 언급된다. [60분봉 분석] 이중 바닥을 형성한 뒤 상승 전환하는 모습이 나타나고 있다. 단기 저항선을 돌파하고 더 높은 저점을 만들면 바닥 형성 가능성이 높으며, 이 경우 $4 선, 더 나아가 $4.30~4.50 수준까지 반등을 기대할 수 있다고 제시한다. [종합 결론 및 리스크] 현재 $3.47 부근은 롱 진입 신호로 보이지만, 반드시 손절선을 설정하고 스토캐스틱 등 확인 지표를 본 뒤 신중하게 진입하라고 권한다. 진행자 말만 믿고 매수하지 말고 자신의 시스템과 함께 검증할 것을 강조한다. [출연자 전망] 단기적으로 AMD가 상승할 가능성이 있다는 견해이며, 장기 구조는 여전히 하락 채널 안에 있다고 본다. 영상 말미에는 유료성 무료 교육 세션과 소프트웨어 홍보가 포함되어 있다.
다듬은 글
hey traders this is John Howell here from trading investing 4 u.com in this video we are going to be looking at AMD the stock it's called AMD on the on the New York Stock Exchange we're going to looking at the closing prices going to be looking at all the other prices as well when it comes to AMD okay fantastic fantastic so let's continue now we're looking at the closing stock price are gonna be looking at the current stock price of AMD we're going to be staying showing exactly what's happening here plus i'm also going to be giving you some strategies on how to read the market so you can understand the market a lot more when you're trading okay fantastic fantastic before I get into this I need to let you know that we are running a training event this is two hours training event to our teaching you to unique strategies that will put you on the advantage of most traders out there this is two hours going in depth to the details to these strategies so if you are looking to get the advantage on most traders out there and you're looking for a full two hour complete training going showing you all the details of steps that little serious link right here that is just below this video if you're watching this on youtube ok so if watching us on youtube that is right there so i click that at the end of this video fantastic let's get into the education now before i start talking about any at any charts this is just general advice only I don't know your personal personal circumstance and yes trading is very very risky if you don't know what you're doing and you can lose a lot of money so if you don't know what you're doing don't trade make sure you get self-educated to make sure you understand the risk the rewards before we taking any investment at all it's absolutely absolutely crucial okay so let's let's continue now let's actually get into the child right now we're looking at AMD weekly that's an AMD weekly chart and what we're seeing right now we're seeing basically back to since 2006 2007 now we'll look at i was looking at basically a moving average through here and what we have through here's we have one of my main moving averages i use and you can see here back in 2005 through six market actually came up through here okay but it was actually sort of mid-2006 we actually started to come off massively through here we started getting below the main moving average and now we started coming down through here we came back above it and now we just sort of gone sideways on a slanted downward movement okay slander them with minute why I say that because we're actually in a mate we're actually in a major major channel right now when it comes to when it comes to AMD so let's have a look here let me squeeze this back up again if we can see here now we can see here that firstly let's let's have a look at this here okay let's just delete that and let's just move this up here foreverment the first thing we see here is we can see that we have a resistance point through here we see we have a support line through there and this whole trend line through here you can see how if I just connect it up through there that right now where we are right now it doesn't have to be finite doesn't have the exact but you can see here when we're looking at we have this resistance point through here there's a support there's a support and the markets getting down to this support live right now so that's at a support level right now ok the next thing we can actually see if i create apparel trend line is actually we're in a what we call a massive massive channel okay it's just going down up down up down so we know we're at a massive support level what else do we see well if we have a look at this here we can see that if I draw a trend line from there to there which picks up all these different points or he had a bit of a support through their resistance through there all the resistance support through their support through there look where we are right now that's at a massive massive support line alright so that's what we see there so at where two massive support lines through them that's looking at a weekly chart right so looking at what we're doing here is we're looking at the weekly chart and we're looking at what's happening on an overall scale so we can see our parameters and what's happening on a bigger picture before we look on the daily chart remember because we're looking at a weekly chart now simply means every single one of these bars represents a weekly bar okay now the next thing we see here is a stochastic Spain pinned massively down here look at that through there okay a stochastics are massively pinned and so what's happening is ah you know that's but it's basically showing you that the overall weekly trend is massively massively oversold and we could be getting a chance of maybe maybe a bit more hostile it okay that's basically what the stochastics are telling us so just keep an eye out so what are we have here we have one support line through here we have another support line through here and we have another support resistance on three so we're in a big channel add a support line through here so that's what our weekly charts saying let's actually scream into now the last 12 months to see what the last 12 ones are seen so now we're going to be drawing a trend line last 12 months so the first thing I want to do is just want to basically draw a trend line up from the peak up here okay so they destroyed turn line from the picker and i'm just going to connect the basically connect all the highest three here and try to get as many highs as possible okay so that's not really you can have that trend line there okay you can have that trend line there or you can have and this is how identify trend lines or you can have this trend line here we can you connect that through there connect that through there and we could or you could connect that through there so which one do you think is more relevant meaning the markets respecting at law this one here or this one here number one or number two number two right because it's getting a lot of lot more touches so we can simply just delete that trend line and now we can see what we have here right we have this major major over or downward movement we have a little have a bounce through there how to bounce through there popped up came back down rejected it through there and now you can see what's happening right now well actually the market is bouncing off that level all way all the way through there it's come back above its bouncing they're bouncing they're bouncing air bouncing air so in a nutshell we actually have three levels of support okay three levels of support we have this one trend line come down through here should use another marker we have this one trend line coming down through here we have the second tranche trendline come down three and we have this other trend line how the horizontal line come down through here so that is at a major what we call a three times support level okay so that's all that's on the weekly chart let's go look at the daily chart now so we're looking at the daily chart right now and we can see exactly what's happening now remember these trend lines here our weekly chart so we're not looking at finite levels we're just looking at the overall scale so if we have a look at this thing through here and if we did just fix this up we can see here okay we can see here what's happening on an overall basis through there okay fantastic so you can see we have this major broke up through there a little bit through their breakup down but this major trend line is really respecting this overall you can see it's big down with move through here so that's what we're seeing on on the daily chart but also what we see here is we see our stochastics on the daily chart as well look at it being pinned look at that through that and it's pointing out right now getting to turn around so add up we'll add a major major support levels three support levels on the weekly chart so the gases are going to pin and that's where we are right now now we can see that let's go have a look at the 60 minute chart okay so let's go look at the 60 minute chart and let's see what's happening on the 60 minute chart so we can see how stochastics are getting into the overbought 60 minute but let's not worry about the stochastics on the shorter term basis because it can sort of filter up and down but let's have a look what's happened here right on the 60 minute chart what do we have we have a one bottom to bottom basically have a double bottom and now we're racing up through here now we're going sideways so what I see here is this firstly let's go back to weekly chart so this is weekly chart firstly we're at a major support level here right with a stochastic service all given us a big overall weekly possible turning point right a major major major support level three times then we move down to a daily chart and we saw that we're way above our moving average which could be a magnet warden okay we're at a massive support level NS the classics are oversold as well giving us a major major turning point then we move down and we went down to the hourly chart okay so i went down to to the hourly chart that's just changes here to Ali ok there we go Ali and now we can see on the hourly chart if I squeeze this write-up we can see this markets come down through here it's others what levels an hour rick is showing up three so if we get luck maybe a bit of a higher trough through here and are breaking above the the levels there you can see he if I just draw one on from there to there you see that's the may just major resistance level through there when it comes with a short-term channel a bit of short-term journal going through there on a 60-minute if we set the break up above through here and start to make some higher troughs that there is likely to be a bottom formation and we're likely to at least run up to the high side of some projection points that may be that may happen in the future okay so projection points would be next resistance next support right so if we do start against the member to the higher site where this market is likely to at least get to to the forefoot hallmark and if not the four dollar mark then if we go to a weekly chart on a bigger time scale so for dollar mark is where it could possibly get to or it looks like it may even run up to around about the 450 4 30 level so there we go guys that's another another market recap for you today there's some is analysis of BM AMD we're looking at the closing price today is obviously three dollars and forty-seven the current stock price is obviously three dollars 47 we're closing will close right now in the New York Stock Exchange but that's what's happening on bmd right now it looks like a very very very nice little entry signal there for going long but obviously make sure that you have your height off in place make sure you have your stochastics in place and wait for the right opportunity do not just get into the stock just because I say it's pretty good okay you must understand that there's riskier then I want to make sure that you are taking this and wrap it around your own system what you're doing so you can start the move forward on your own doing that okay it's really really really important but I see some nice little entry points happening here on AMD and I'll see that we could possibly see some a bit more upside with bit AMD moving forward at least for the short term anyway okay fantastic fantastic guys well that is it for me make sure that you have a great day make sure that you look after yourself and again make sure that you click on that link below there's a link right here click on that link below right now if you're on YouTube and head over there and register for the two hour free training right where I'm going to teach you to full detailed strategies that's going to give you the advantage on most traders out there you just like one system i'm going to teach you to more systems to more systems that's going to really really blow you away a very very simple plus an amazing piece of software that does all the hard work for you okay so head over there right now and check it out click on the link below right now okay this is John Howell here from trading investing 4 u.com check us out on Facebook which is facebook.com thoughts are share trading mastery and also check us out on YouTube which is youtube.com forward slash trading and investing youtube.com for size trading investing so click on click on that link below right now garage for the free training event check us out on youtube check us out on the web site and make sure that you click on this like button see this like button here if you could click on the like button to tell me you like this information that'll be fantastic well thanks very much guys have a great day and I'll see you in the next video and no matter what happens say this to yourselves every morning every afternoon or evening and nutty success can be yours if you go to claim it so step up take massive action and face your fears today


Comments 0