원문 보기
My goal is very simple, to make you money . I am here to provide equal opportunities for all investors. There is always a bull market somewhere , and I promise to help you find it . Mad Money is just beginning. Hey, I'm Kramer. Welcome to Mad Money. Welcome to Cray America . Others want to make friends .
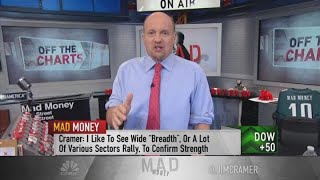
I'm just looking to make money. My job is not only to entertain you, but also to educate you. So, call me at 1800743 CNBC or tweet to Jim Cramer on Twitter. Those who watch Mad Money closely know that I am not a chartist, but I pretend to be one on TV once a week, showing you the technical methods for predicting the next big move in stocks.
Since I base my work entirely on fundamentals, the off-the-chart section is at odds with my traditional stock selection methods. But I know from your feedback on Twitter that you are interested in this analysis and, most importantly, that it has proven to be of benefit to many people to the right degree.
Just because I devoted a chapter to charting in the book 'Get Rich Carefully', as I explained, doesn't mean I've become a chartist . I still choose stocks only after studying fundamentals, research, annual reports, sectors, and comparing them with my current broader worldview . Chartists have little to do with these matters .
They often don't even care what the company does. I wonder if they can do their job even if the company names are hidden. In fact, I believe they definitely can . Some of them are reluctant to pay attention to the company for fear that if they find out about it, it will change their opinion of the stock chart.
Can you imagine? I have become proficient at charting over the past few years , but I still rely on the work of expert technicians to learn how to use charting and the techniques I can teach you . That's why tonight I'm picking the best of the best technicians' charts we've worked with , exploring patterns that are so reliable that you'll be surprised at how accurate they are .
So, you might call me a long-term believer . Hey, you know what? That's why every Saturday morning for the past 30 years I've started reading the Standard & Poor's Trendline Daily Action Stock Charts , which used to be on paper , now in electronic form, containing hundreds of charts, and I compare those charts to patterns I've learned over time .
Then I look at the available research for the most profitable charts , which often become segments on the show you watch later in the week. Why do charts work? People always want to know . First, you have to think of them as footprints at a crime scene. These footprints reveal what big money managers are doing with the buying and selling of dollars .
These portfolio managers at large funds often know more than you and I do . Charts showing where their money goes , stock charts, put together the evidence left behind by these big men . The second reason is that stock charting has an amazing self-fulfilling nature . Many experts look at these images and take them seriously, so much so that they choose stocks that are worth owning, leaving aside stocks with predictably abysmal charts.
Stocks whose charts have shown positive movements in the past. I don't know . When I worked with Karen Cramer , she was a veteran chartist at my old hedge fund . She would look at the charts every morning, look for what appeared to be potential breakouts and breakdowns, and then ask me to research the ones with the most predictable patterns to understand what was happening.
Some of our best ideas came from those chart-inspired brainstorming sessions. A true and successful combination of technical and fundamental elements to deliver excellent short and long term results. All charting and technical analysis begins not just with images of individual stocks, but also with what are known as 'internals' .
Internal patterns about stocks that give you clues regarding the direction of the overall stock market . Since the Great Recession, which exposed the underlying weakness of our economy, and the systemic risk I talked about , there has been a lot of skepticism about the rise of stocks . While I believe that systemic risks have decreased , I know that every rally creates worrying risks .
I know you're afraid that you're entering too late or at too high a price and will lose money. Sell, sell, sell. Good technical analysis involves analyzing indicators that help determine the overall direction of the market. This is more important than ever because many stocks are influenced by S&P 500 stock futures .
Sometimes, for technicians , it all comes down to combining individual company charts and charts of larger averages to create comparisons that give clear conclusions about true market strength . They are looking for something called 'confirmation' to determine the authenticity of a movement. I think verifications are very important for the safety of a move .
They should be explained in detail. The most important and clear confirmation. For example, let's say the Dow Jones Index hits a new high . Okay. Historically, that high is not sustainable until the Dow Jones Transportation Index also hits a new high, confirming the Dow's breakout . The Dow Jones Transportation Index is a measure of trade.
It tracks trains, planes, trucks, and freight. Yeah, isn't that a really good indicator? I often say that if both the industrial and transportation indices hit new highs, the move is real and credible. That's true. This is an old technical analysis dating back to the days of Charles Dow, founder and first editor of the Wall Street Journal, who created the Dow Theory to validate rallies.
You often hear me say that I like how the transportation indicators work at the beginning of the program. Because I will observe whether the movement has the stability to approve it . I will also consider other indicators . The banking index is very important to me. Housing index too. I look at the semiconductor index or SOX (SOX) and RTH.
That's the most important ETF that holds large retailers. Before I endorse the market move for you , I like to see all these indices moving up in concert . If all these indicators are moving upwards, you will need to invest maximum . Oops. But what if the opposite happens? If the market moves up without confirmation from the majority of these indices, the entire rally could be a lie.
And it can't be believed. The classic example is that if you look at the record highs that were recorded before the economic recession, you notice a remarkable thing. If you study it again , you will find that there is almost no participation from the financial, retail or tech sectors. Technical analysis got you out of that market before it was too late .
If you follow those indicators , you will get better results than fundamentals. What other internal elements do I see? I analyze advances and declines to determine if the rally is too concentrated . I like a market with good participation from many different groups . I also look at the ratio of new highs and new lows.
Remember , getting into the new high list is not easy. First, the company must perform exceptionally. Second, the sector must be strong. Third, major forces, the Federal Reserve, interest rates, geopolitical tensions, and politics all have to come together to make a stock successful enough to make it onto the new list .
That top-level list is the most unique . You go through difficult situations and pick a good stock, that's the stock I want to buy when the market is down due to stress, not because the stock itself is weakening. And, if there are a lot of stocks on the list that are making new highs from many different industries , that's a very good sign.
So, this is the real thing. You may not be a technician, but you should know what the charts are saying and you should know how to read the internals to identify a real move or a fake one . Stay tuned , we'll discuss several prediction models used in everything we do here. Not just on Tuesday charts, but also in stock selection every day.
Jim from Michigan. Gym. Gym. Hello. How are you? Thank you for taking my call. Sure. I'm so glad you called. What's special? You have a question . In the section where you are talking about secular stocks. Can you define for me once again what secular stocks are and give me one or two examples ? Sure.
Look, this is a very important point because this word is used in many contexts. People think secular means regional. Secular means that a secular growth stock is a stock that can outperform expectations without the need for global GDP to increase . Some classic secular growth stocks might be some biotech companies .
There may also be some retail companies that are experiencing excellent growth . Gary from California. Gary. Mr. Kramer. You are welcome. Booya. Gary. Gary from California. My question is about dividends when the market is falling, sir. If you are accumulating dividends on certain stocks as you suggest , is it better to reinvest them when the market falls or to cash them out and invest in other opportunities ?
Look, we don't know when the fall will end. And we know that the power of compounding is a wonderful thing. So, we always stick to this on this show . It may seem common, but we always tend to reinvest because wealth is created through the power of compounding . I will stick to this regardless of the short-term consequences , because I am thinking long-term for you .
Fundamentals, they are very crucial. But techniques are also important. Tonight, I'm taking you into the world of Mastermind charts, so you can understand the full picture behind stock movements . We know that charts are important, but what technical tool helps identify stocks' lows and highs? I am revealing about it now .
How do you know if a company's shares are likely to be overbought and fall, or oversold and rise ? And mixing patterns isn't just for fashion . I am sharing important patterns that yield profits when investing . So, why shouldn't you be with Cramer ? Don't give up on Mad Money for even a moment. #mad tweets to Kramer .
? But go to madmoney.cnbc.com. Boo! Boo! Jimmy! Boo! Mr. Kramer, thank you for taking my call and for everything you do for us . I've been listening to your program for a long time, but this is my first time calling . After reading every book you've written five times, I was able to leave my traditional job at the age of 37 and build a successful full-time career managing my own portfolio .
I have been watching your show for about 10 years . Thank you for everything you do. Thank you for everything you do for us, Home Gamer. I would like to thank you for sharing your market knowledge . You have undoubtedly influenced my approach as a serious investor .




Comments 0